
Backtesting the ADX Filter on Any Stock [Free Backtest File]
Published on September 5, 2026 | 10 min readTable of Contents
- Key Takeaways
- What the ADX Filter Does in the Scanner
- What Our Backtest Actually Measures
- How to Read a Sideways Result (An Example on USO)
- How to Read a Bullish Result (NIO)
- How to Read a Bearish Result (CVNA)
- When All Three Settings Pass: The PYPL Example
- Understanding the Methodology (and Its Limitations)
- Your Checklist Before Trading an ADX Signal
- Run Your Own Backtest
Reviewed by Leav Graves
Table of Contents
- Key Takeaways
- What the ADX Filter Does in the Scanner
- What Our Backtest Actually Measures
- How to Read a Sideways Result (An Example on USO)
- How to Read a Bullish Result (NIO)
- How to Read a Bearish Result (CVNA)
- When All Three Settings Pass: The PYPL Example
- Understanding the Methodology (and Its Limitations)
- Your Checklist Before Trading an ADX Signal
- Run Your Own Backtest
We have just added the ADX indicator as a filter inside the Option Samurai scanner, which means you can now screen the market for stocks that are moving sideways, trending up, or trending down, and combine that condition with everything else you normally look at: implied volatility rank, liquidity, expected return, and the rest.
Finding the stocks is the easy part. The harder question comes right after: has this filter ever meant anything on the specific stock the scan returned? A sideways reading on one name can genuinely mark its quiet periods, while the same reading on another name tells you nothing at all.
This is exactly what our free backtest notebook is designed to answer. It looks at every day a stock has spent in each ADX state since 2019 and reports what the stock actually did over the following two weeks. In this article, we will guide you through how to read that output for all three settings, using five real examples, and we will also show you the mistakes that can make a good-looking result meaningless.
KEY TAKEAWAYS
- The ADX filter has three settings (sideways, bullish, and bearish), and each one requires a different test. A number that validates the bullish setting tells you nothing about the sideways one.
- Judge a sideways result on the spread of outcomes rather than the average. A low ADX reading does not push a stock in either direction; it makes the range of results narrower, which is what matters when you sell premium.
- On the two directional settings, always read the mean and the median together. When the mean is strongly positive but the median is not, a few outliers are carrying the result, and that changes which strategy you should use.
- Our free Colab notebook comes in two versions: a simple one that scores all three settings in a single click and an advanced one for readers who want to change the parameters and inspect the method.
What the ADX Filter Does in the Scanner
The Average Directional Index, developed by J. Welles Wilder, measures how strongly a stock is trending without indicating the direction of that trend. Direction comes from two companion lines, the Positive Directional Indicator (DI+) and the Negative Directional Indicator (DI-). Together, the three lines let you sort any trading day into one of three states.
The scanner uses the following definitions, and our backtest file (available at the bottom of this article) uses exactly the same ones so that the two always agree:
- Sideways: ADX below 20. There is no meaningful trend in either direction.
- Bullish: ADX at 20 or above, with DI+ above DI-. There is a trend, and it points up.
- Bearish: ADX at 20 or above, with DI- above DI+. There is a trend, and it points down.
The 20 threshold is a convention rather than a law, and some traders prefer 25. We use 20 because it is the boundary the scanner uses, and because consistency between the screen and the backtest matters more here than the precise level.
These three settings correspond to three different kinds of trade. The sideways setting is a bet on a range holding, which is what an iron condor or a short strangle needs. The two directional settings are bets on drift, which is what a credit spread or a debit spread needs. Because the trades are different, the evidence you should demand from each is different too, and this is the single most useful idea in this article.
What Our Backtest Actually Measures
For every trading day in the stock's history since 2019, the notebook records which ADX state the stock was in, then measures the price change over the following ten trading days. It groups those measurements by state and compares each group against the same measurement taken across every day in the sample. That last figure is the baseline: what you would have got by showing up on a random day with no filter.
The difference between the two is what we call the edge, expressed in percentage points:
Edge = [the state's average 10-day move] -[ the average 10-day move after any day]
This comparison is the whole point of the exercise. A statement like "bullish readings averaged +5% over the next two weeks" sounds impressive until you learn that the stock averaged +5% over any two weeks in the same period. What you want to know is whether the filter beat simply being invested, and the edge is the number that tells you.
The pass mark then depends on the setting:
- Bullish passes when its edge is positive.
- Bearish passes when its edge is negative.
- Sideways is scored differently. It should compress the spread of outcomes rather than move the average anywhere, so we look at the standard deviation of the results instead of their mean.
Why ten trading days? It corresponds to roughly two weeks, which is close to the holding period of a typical monthly credit spread opened at 30 to 45 days to expiration and managed early. It is a reasonable default rather than a magic number, and the advanced notebook lets you change it.
How to Read a Sideways Result (An Example on USO)
Let us start with the oil ETF USO, because it produces one of the cleanest sideways results we found.
USO, 2019 - 2026 | Days | % of time | Avg 10-day move | Spread |
Sideways (ADX < 20) | 1,043 | 54.9% | +0.45% | 5.78% |
Bullish (ADX 20+, DI+ top) | 452 | 23.8% | +1.68% | 8.42% |
Bearish (ADX 20+, DI- top) | 395 | 20.8% | -0.22% | 13.44% |
Any day (baseline) | 1,900 | - | +0.60% | 8.57% |
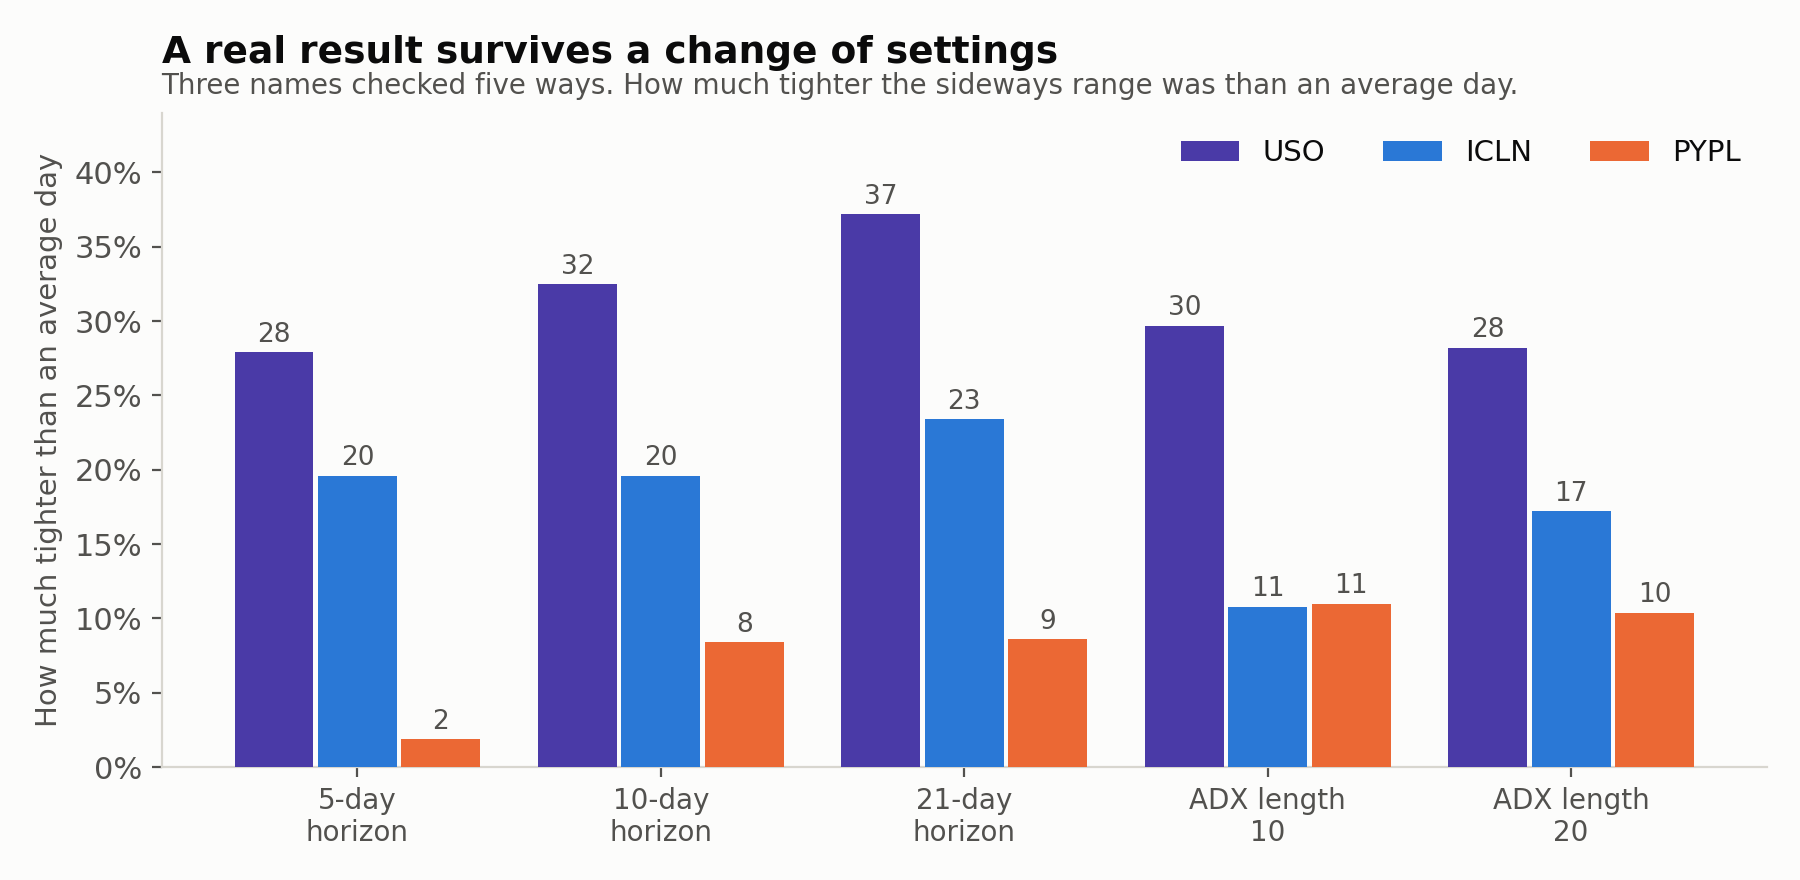
Ignore the average column for a moment and read the spread instead. After a sub-20 ADX reading, USO's ten-day outcomes scattered by 5.78%, against 8.57% on an average day. That is 32% tighter, and it is a large, clean pass on the test that matters for this setting.
Now go back to the average column: +0.45% for the sideways state against a +0.60% baseline. The two are barely different, and the filter did not stop USO from moving. It narrowed the range of places USO was likely to end up, which is a different and more modest claim. If you were hoping for a flat chart, just know that this is not realistic. But the important takeaway here is that you should probably build a sideways strategy in which your short strikes are well beyond that 5.78% spread.
Before you trade a result like this one, there is one more check worth running. A finding that only exists at a single combination of settings is not a finding. Re-run the backtest at a five-day and a 21-day horizon, and with the ADX length set to 10 and to 20. If the compression survives all of them, it is a property of the stock (or the ETF, in this case). If it appears once and disappears at the next setting, you caught noise. The image below compares the behavior of USO and other 2 tickers when the ADX indicator falls below 20:
A confirmed sideways result points toward short-premium structures: an iron condor, a short strangle, or a credit spread on one side. You are being paid for a range holding, and the backtest is telling you that this particular stock has historically respected the range more than usual when its ADX was low.
How to Read a Bullish Result (NIO)
Once the ADX clears 20 with DI+ on top, the theory says you have a confirmed uptrend. The backtest tells you whether that confirmation was worth anything on the stock in front of you. For this example, let’s consider a ticker like NIO:
NIO, 2019 - 2026 | Days | % of time | Avg 10-day move | Median | % up |
Bullish | 565 | 29.7% | +5.23% | +2.19% | 57.7% |
Any day (baseline) | 1,900 | - | +1.08% | - | 45.8% |
That is an edge of +4.15 percentage points (5.23% - 1.08%). The mean and the median agree with each other, which is what a healthy directional result looks like.
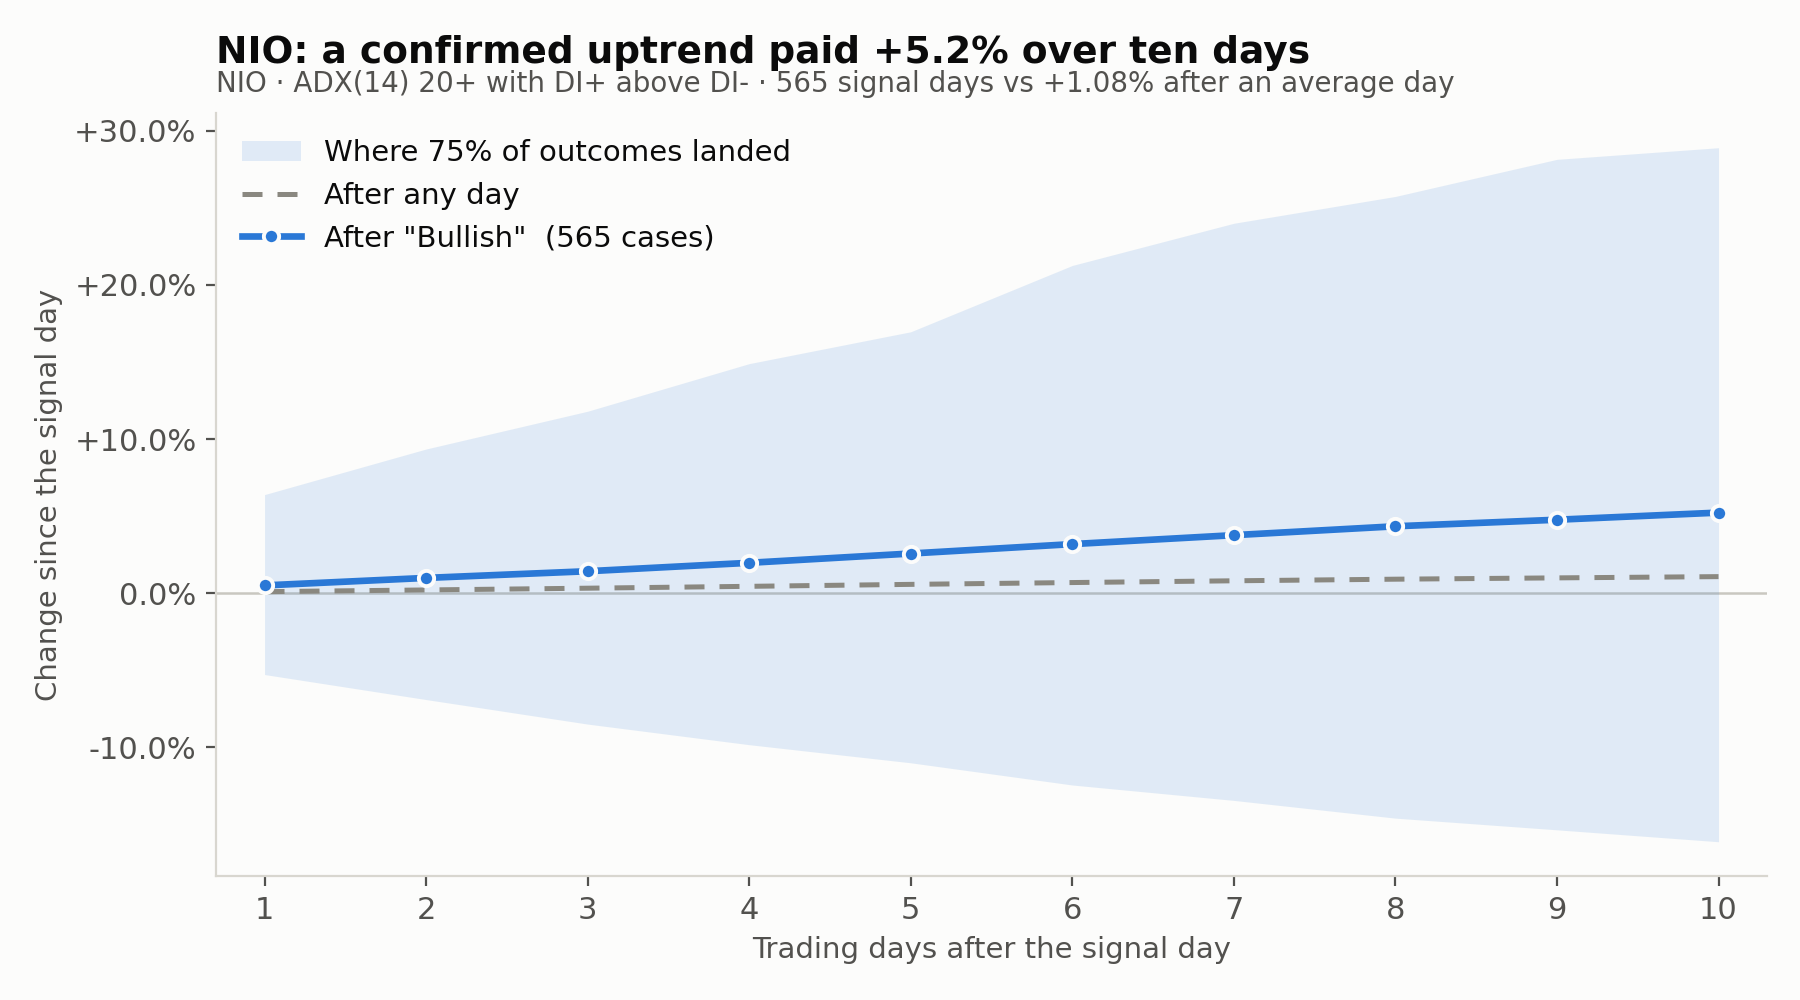
You can see this from the image above, that shows the behavior of NIO after a confirmed ADX uptrend. The average path climbs steadily, while the shaded band shows the range of outcomes you are actually exposed to.
An Exception to Consider: When the Mean and the Median Disagree
Now run the same check on MARA and you will find an even bigger bullish edge: +4.65 points, on an average ten-day move of +9.00%. It looks like a better result than NIO until you read the next column.
MARA's median bullish outcome was -1.07%, and only 47% of the signal windows finished up.
The average says +9%. The typical trade says -1%. That gap is the signature of a handful of enormous winners dragging the mean somewhere the median never went, and it is a trap you may want to avoid.
Let’s compare MARA and NIO from a visual point of view:
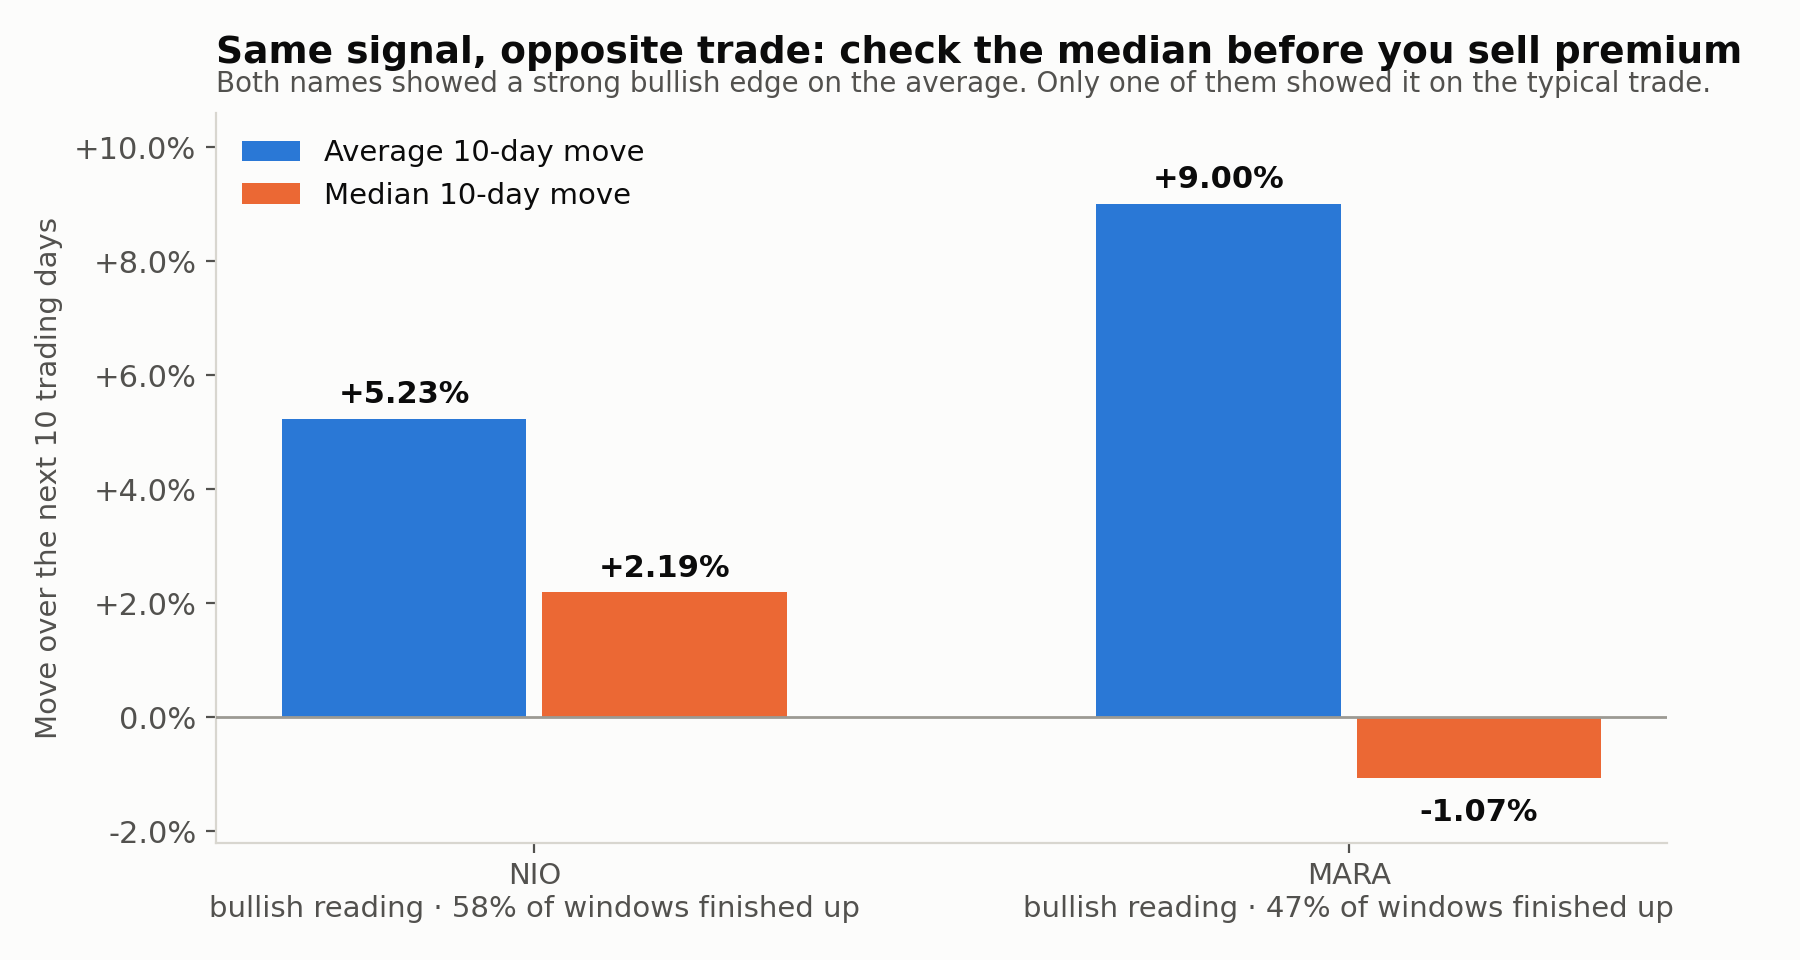
The two stocks show a strong bullish edge on the average, but only one of them (NIO) shows a healthy result.
How to Read a Bearish Result (CVNA)
The bearish setting is the one that gets run least often, and in our experience it is frequently the most informative of the three. Let’s look into a new ticker, CVNA:
CVNA, 2019 - 2026 | Days | % of time | Avg 10-day move | Median | % up |
Bearish | 512 | 27.0% | -1.06% | -1.26% | 47.5% |
Any day (baseline) | 1,899 | - | +3.25% | - | 55.3% |
An edge of -4.31 points is one of the largest you are likely to see. It kept its sign at every horizon and ADX length we tested (-1.80, -4.31, -2.13, -3.96 and -3.25), and in both halves of the sample. When we sampled one window every ten days so that no two windows shared a day, the edge was still -3.93 points.
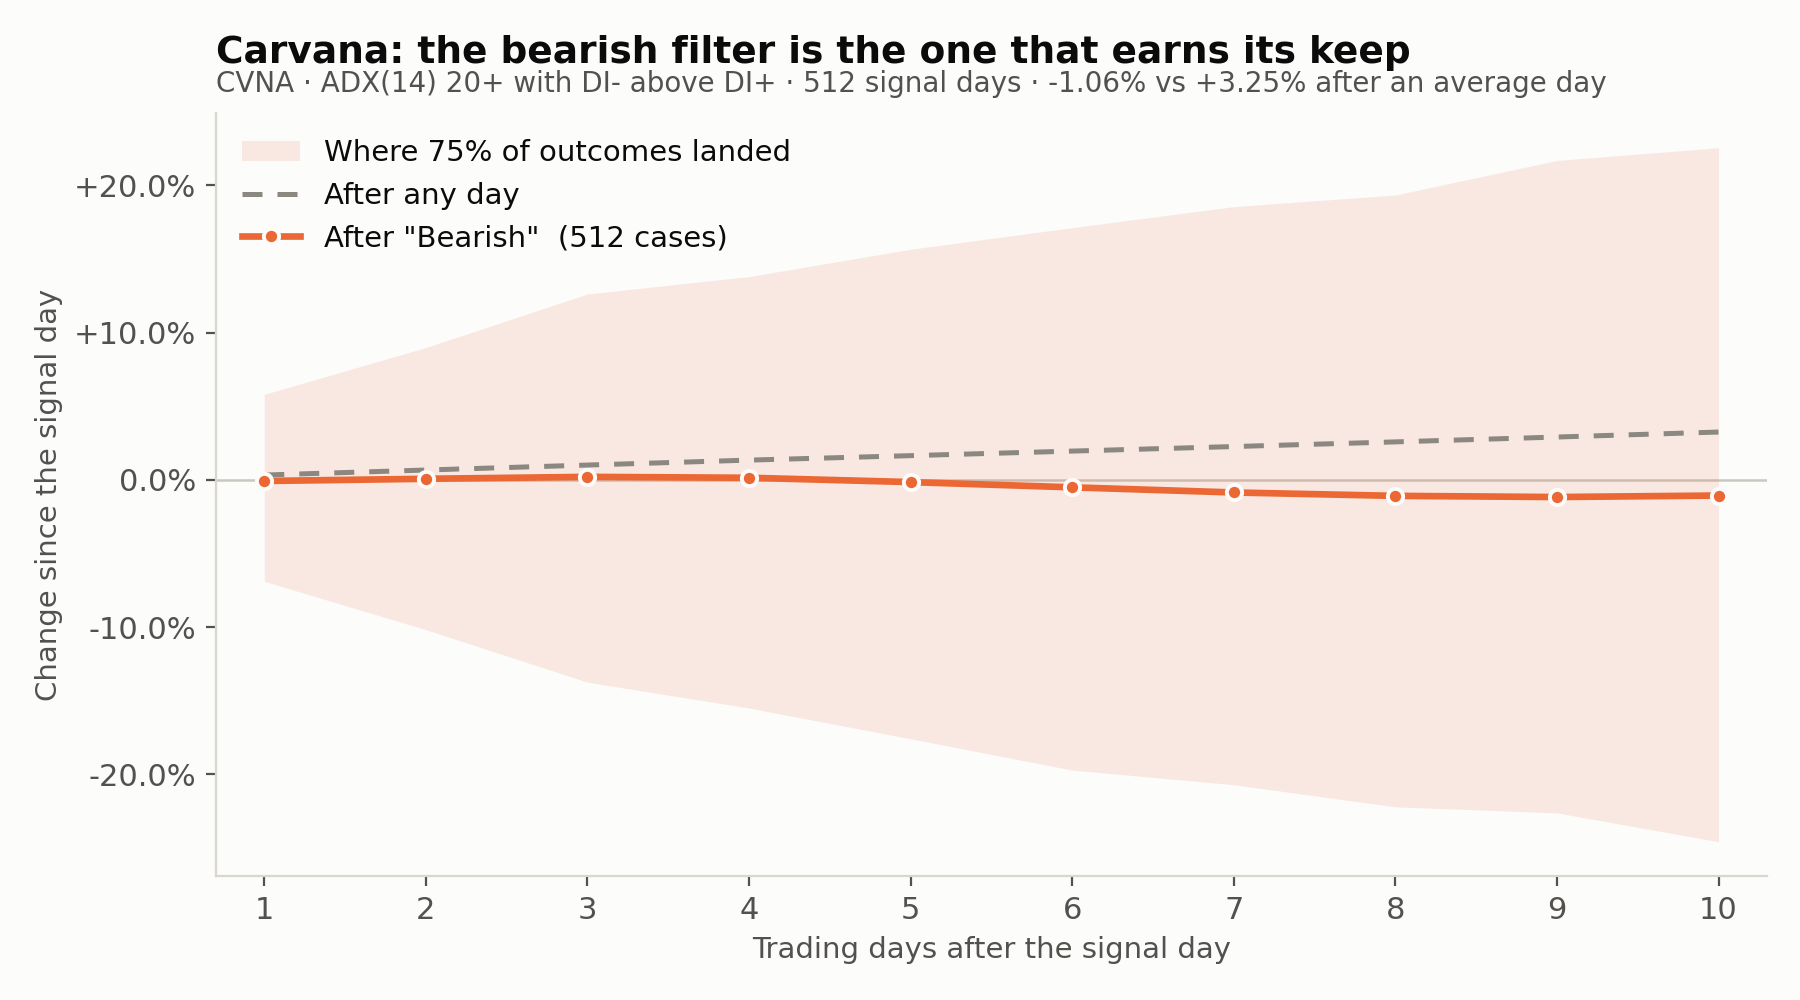
Clearly, CVNA tends to move down after DI- takes the lead. The signal line sits below zero while the baseline drifts up.
Read the absolute number before you act on a result like this. CVNA's bearish average is -1.06%, which is barely negative. The edge is not telling you that Carvana falls after a bearish reading. It is telling you that Carvana tends to stop doing the +3.25% it does on average.
When All Three Settings Pass: The PYPL Example
Occasionally you will run the backtest and find that every setting works. PayPal is a good illustration of what that looks like, and also of how to stay sceptical when you find one.
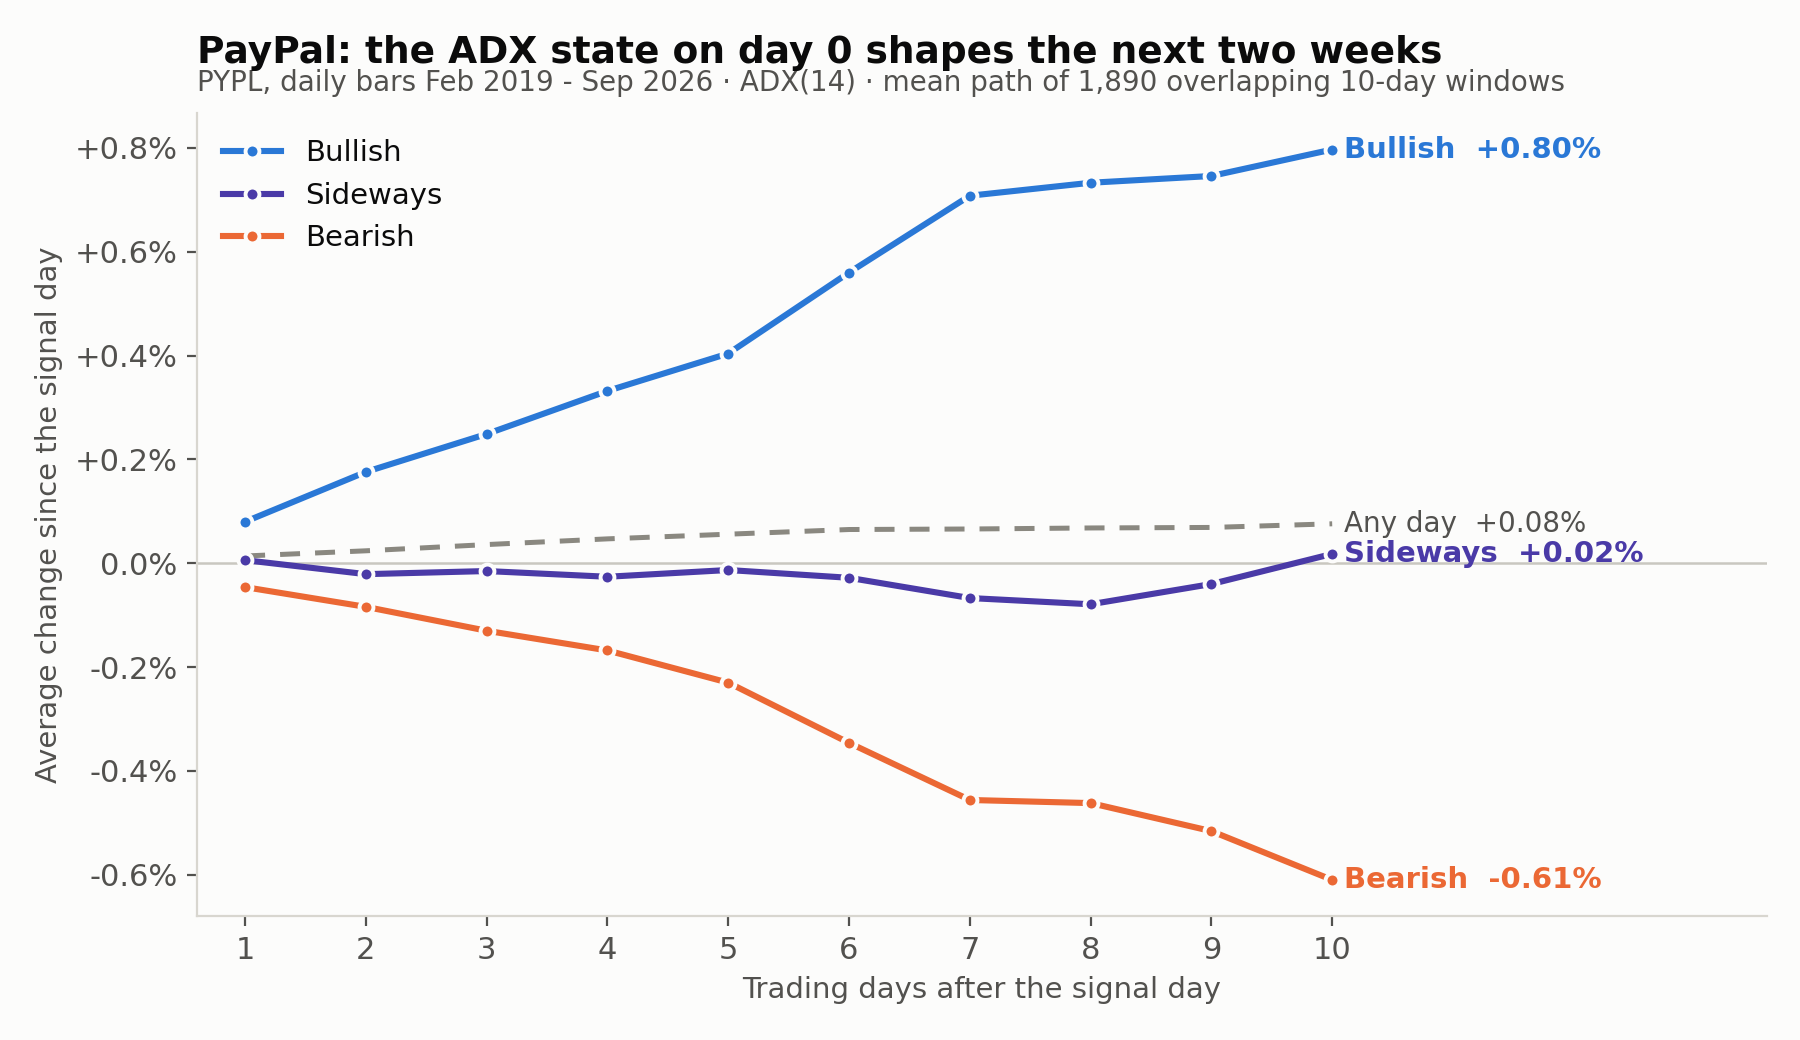
PYPL, 2019 - 2026 | Condition | Days | % of time | Avg move | % up | Spread | Edge |
Sideways | ADX under 20 | 664 | 34.9% | +0.02% | 50.3% | 7.36% | -0.06 |
Bullish | ADX 20+, DI+ on top | 625 | 32.9% | +0.80% | 58.1% | 7.46% | +0.72 |
Bearish | ADX 20+, DI- on top | 601 | 31.6% | -0.61% | 50.9% | 9.20% | -0.69 |
Any day | - | 1,900 | - | +0.08% | 53.1% | 8.04% | - |
This is an ideal case, and you can see it even better on a chart:
It may be feeling like luck, but that’s actually a pretty solid result as you can see below:
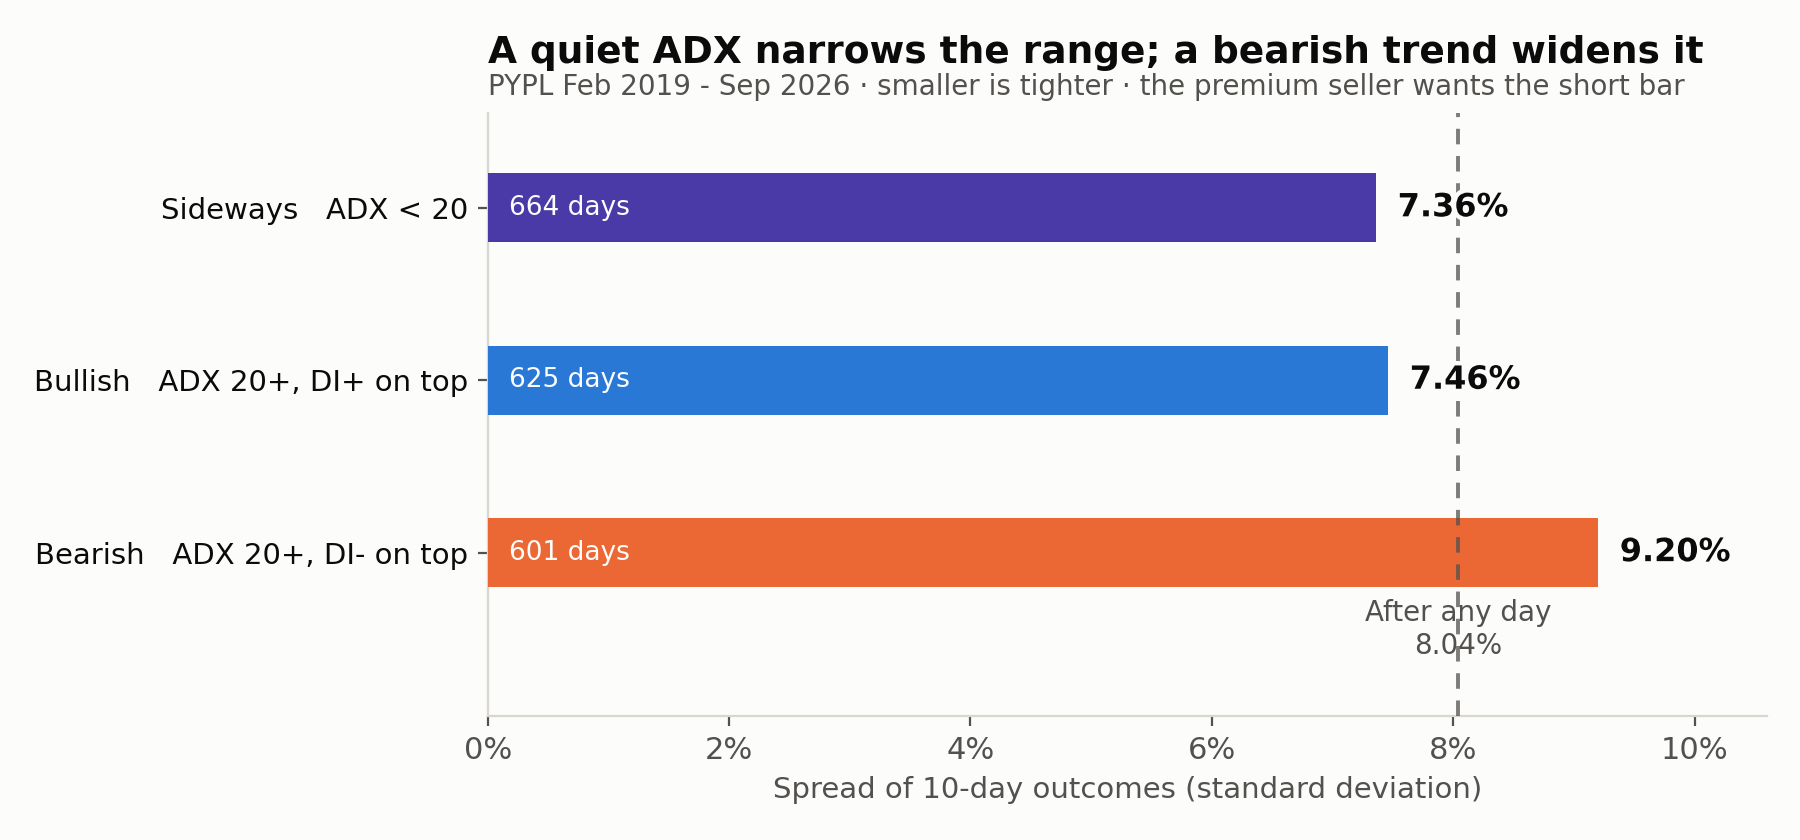
As you can see above, PayPal spent 35%, 33% and 32% of the period in each one, with more than 600 days in every bucket. The sideways spread came in tighter than the baseline. The bullish edge of +0.72 came with 58% of windows finishing green and a median of +1.32%, so the mean and median agree and this is the NIO shape rather than the MARA shape. The bearish edge of -0.69 came with an average that is negative in absolute terms, unlike Carvana.
Understanding the Methodology (and Its Limitations)
Like every statistical tool, this one has boundaries, and your analysis has to take these into account:
- Overlapping windows inflate the apparent sample size. A stock stays in one ADX state for weeks at a time, so consecutive signal days describe almost the same two weeks of price action. Six hundred signal days might represent something closer to sixty genuinely independent observations.
- A single setting is not a result. If an edge only appears at a ten-day horizon with a 14-period ADX, you have most likely found a coincidence. Change the horizon and the ADX length before you believe it, because real properties of a stock are stubborn.
None of this is an oracle. It is a way of asking one specific question - has this filter ever meant anything on this stock? - and getting an honest answer before you commit capital.
Your Checklist Before Trading an ADX Signal
Open the backtest notebook, type in the ticker from your scan, select the filter you screened for, and run it. All three settings are scored on every run, so you get the complete picture regardless of which one brought you there.
Then work through the following, in order:
- Sample size. Does the state have more than roughly 200 days? A filter with 60 signal days is telling you about 60 days.
- Sideways. Is the spread meaningfully below the baseline spread? Anything under 5% tighter is noise.
- Bullish. Is the edge positive and the median positive as well? If only the mean is positive, consider buying the move rather than selling it.
- Bearish. Is the edge negative? Then check whether the average is negative in absolute terms or only relative to the baseline, because the answer determines your structure.
- Stress it. Re-run at another horizon and another ADX length. The signs should not flip.
- Split it. Does the edge still exist in the recent half of the sample, or only in the older half?
If the stock clears all six, go back to the scanner and screen for the actual trade. Because the ADX filter sits alongside IV rank, liquidity and expected return, you can move from "the sideways state works on this name" to "here are the iron condors that pay enough to be worth trading" without leaving the page.
Run Your Own Backtest
Using ADX to Backtest Iron Condors (Blog)
AUTHOR
 Gianluca LonginottiFinance Writer - Traders Education
Gianluca Longinotti is an experienced trader, advisor, and financial analyst with over a decade of professional experience in the banking sector, trading, and investment services.
REVIEWER
 Leav GravesCEO
Leav Graves is the founder and CEO of Option Samurai and a licensed investment professional with over 19 years of trading experience, including working professionally through the 2008 financial crisis.