
Backtesting the Parabolic SAR Filter on Any Stock [Free Backtest File]
Published on September 20, 2026 | 7 min readTable of Contents
- Key Takeaways
- What is SAR
- Using the SAR Filter in the Scanner
- Why We Built a Backtest (and What You Get From It)
- The Option Samurai SAR Backtest
- A Bullish Example: Carvana (CVNA)
- A Bearish Example: Tesla (TSLA)
- One More Lesson: Compare the Average With the Median
- Your Checklist Before Trading a SAR Signal
- Run Your Own Backtest
Reviewed by Leav Graves
Table of Contents
- Key Takeaways
- What is SAR
- Using the SAR Filter in the Scanner
- Why We Built a Backtest (and What You Get From It)
- The Option Samurai SAR Backtest
- A Bullish Example: Carvana (CVNA)
- A Bearish Example: Tesla (TSLA)
- One More Lesson: Compare the Average With the Median
- Your Checklist Before Trading a SAR Signal
- Run Your Own Backtest
We just added the Parabolic SAR as a filter inside the Option Samurai scanner, together with a free backtest file you can run on any stock. This article covers three things: what SAR is, how to use it in the scanner, and how to check whether the signal has actually worked on the stock you are about to trade.
KEY TAKEAWAYS
- Parabolic SAR is a simple indicator that puts dots on a stock chart. When the price is above the dots, the stock is in an uptrend. When it is below the dots, it is in a downtrend. We let you filter stocks by their SAR signal: bullish, bearish, or a fresh flip in either direction.
- Our free backtest file shows whether a SAR signal has actually worked on a specific stock, by comparing what happened after the signal with a benchmark of what happens on a random day.
- The number to look at is the edge: how much better or worse the stock did after the signal than usual. A positive edge means the signal helped. A negative edge means the stock did worse than usual, even if it still went up.
What is SAR
Parabolic SAR stands for "stop and reverse." It places a small dot on the chart each day, either below the price or above it.
When the dots sit below the price, the stock is in an uptrend and the dots trail the price higher. When they sit above the price, the stock is in a downtrend and they trail it lower. The dots speed up the longer a trend runs, so sooner or later the price touches them and they jump to the other side. That jump is the signal the indicator is named after: the trend may be turning.
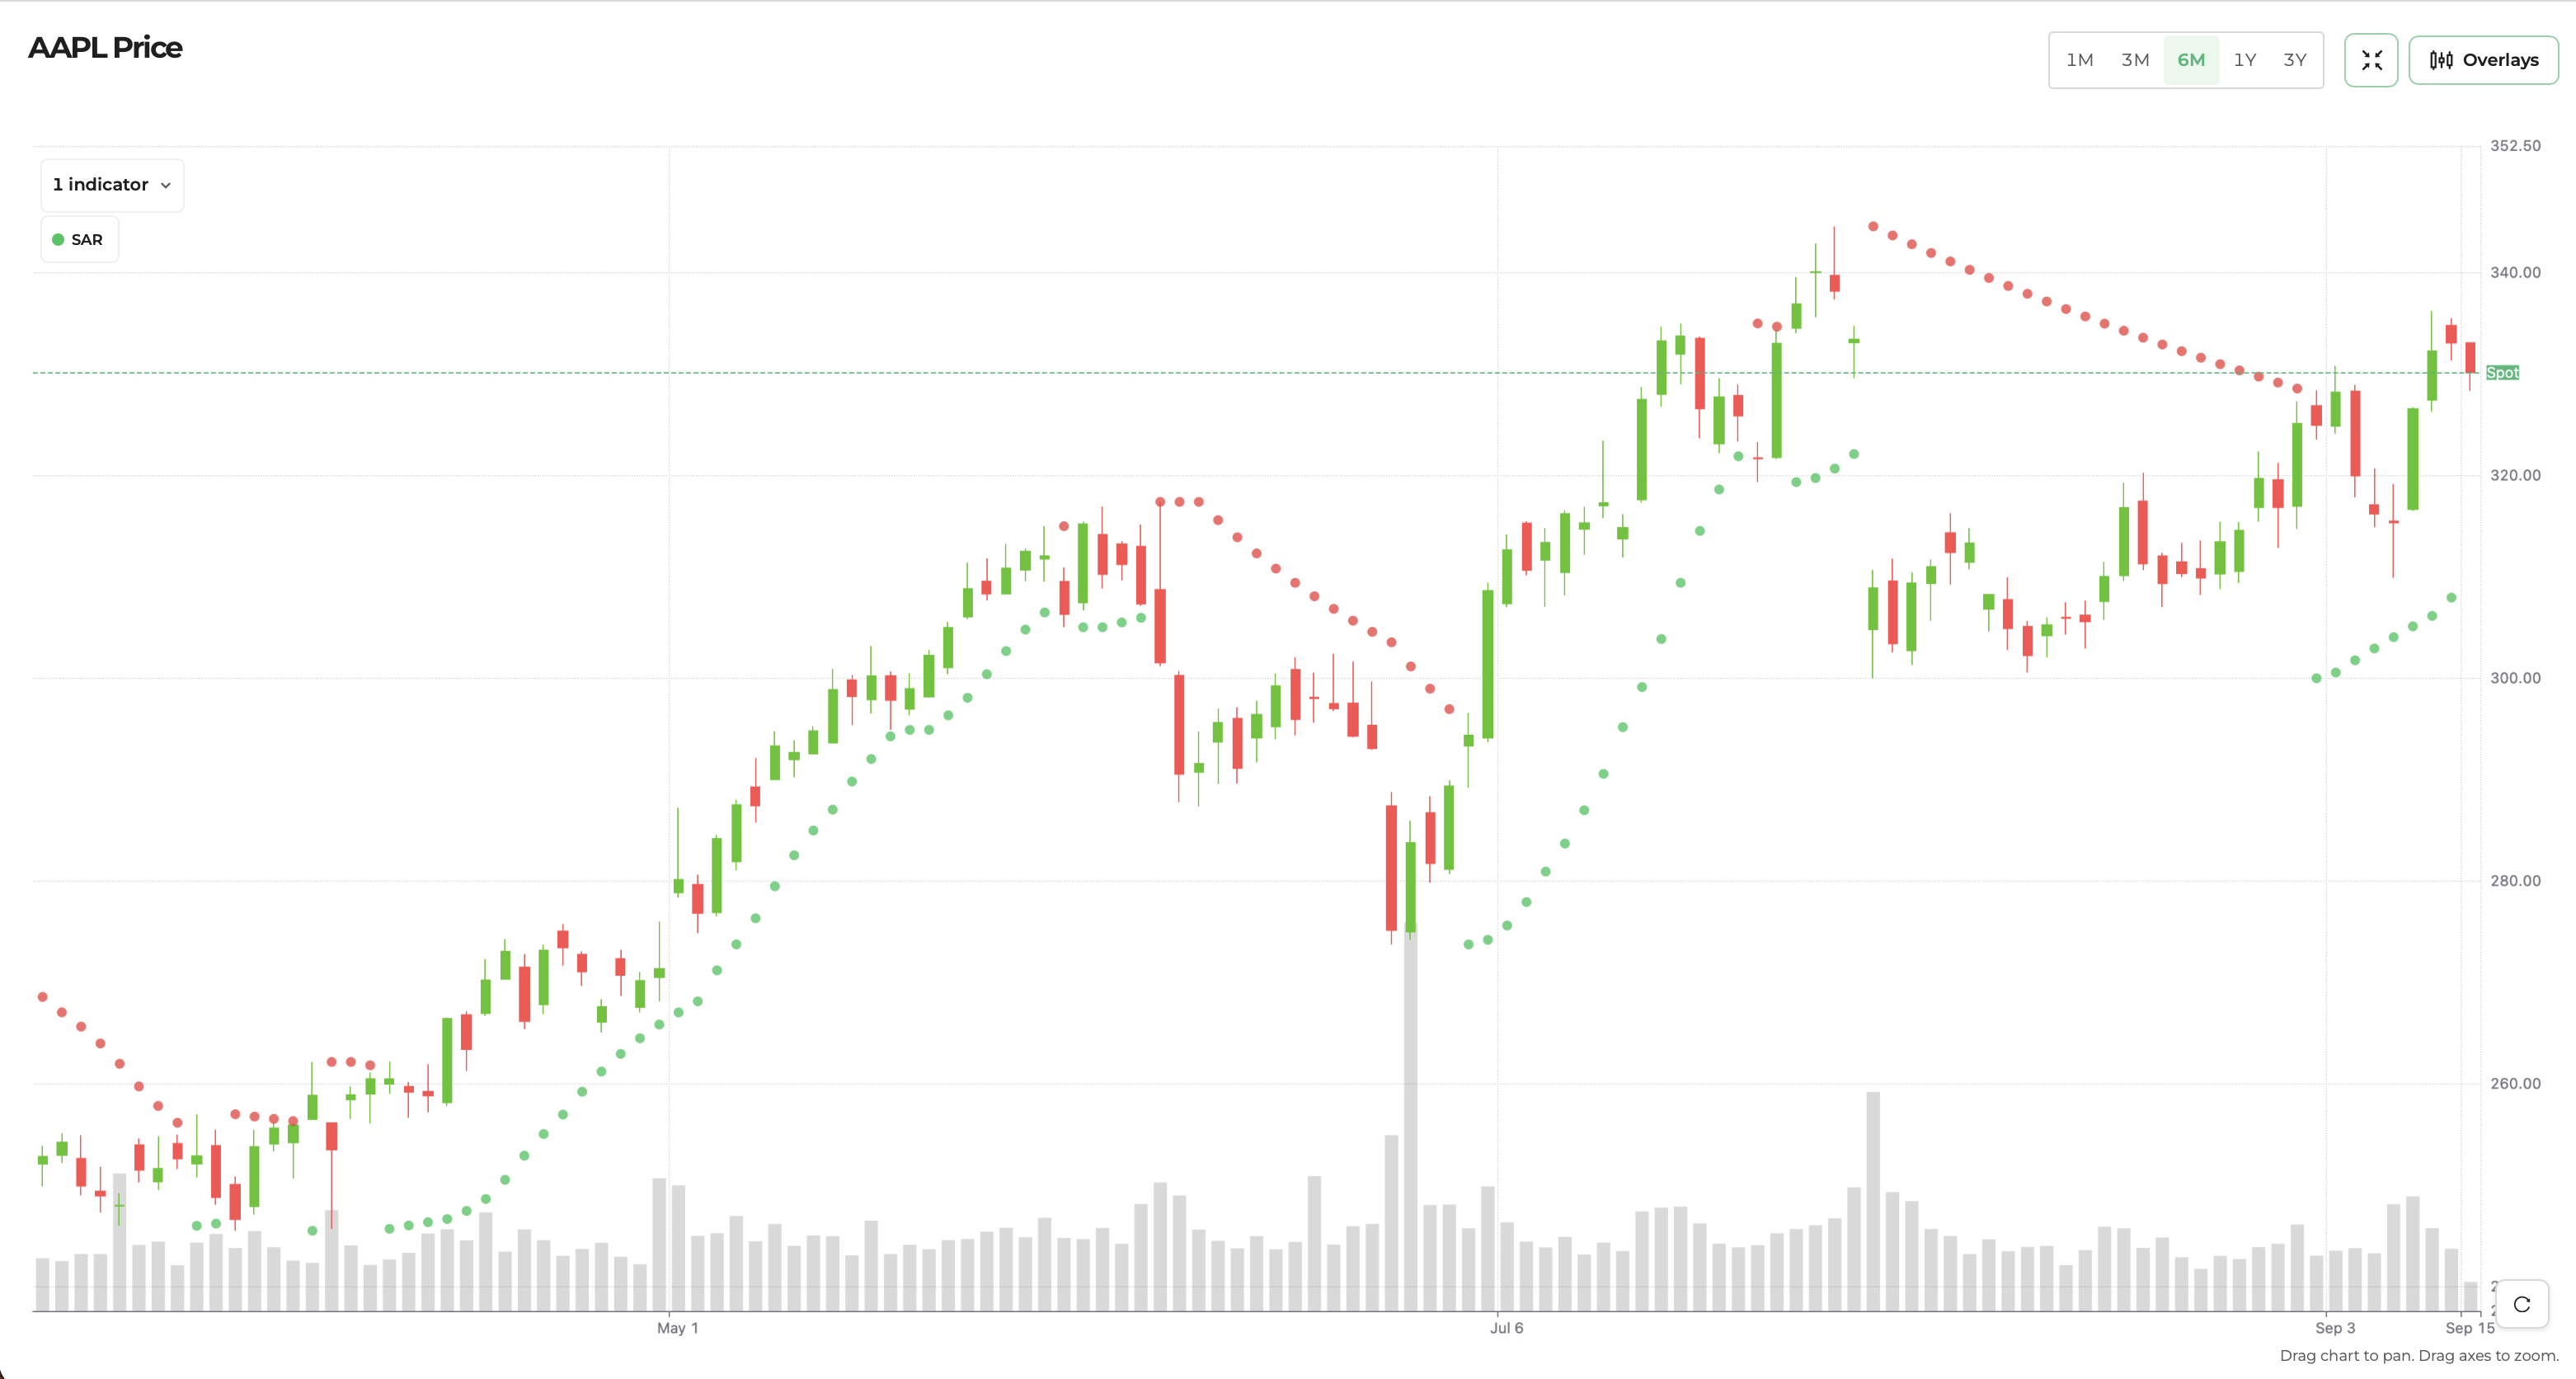
Traders use SAR in two main ways: to see which side of the trend a stock is on, and to catch the moment the trend flips.
Using the SAR Filter in the Scanner
The scanner turns SAR into four ready-made filters:
- Bullish - the price is above the dots.
- Bearish - the price is below the dots.
- Flipped to Bullish - the dots just jumped below the price, on the latest bar or the one before.
- Flipped to Bearish - the dots just jumped above the price, same window.
The first and third overlap: every fresh flip up is also a bullish reading. The difference is age. "Bullish" can include a trend that has been running for months. "Flipped to Bullish" only catches the first two days of a new turn.
All the numbers in this article use the scanner's default SAR settings on daily data from 2019, looking ten trading days ahead.
Why We Built a Backtest (and What You Get From It)
A SAR signal tells you where a stock sits today. It does not tell you whether that signal has ever been useful on this particular stock. Some stocks have respected SAR for years. Others ignore it completely.
That is why we built the backtest. Before you trade a signal, you can check what that same signal has done on the exact stock you are looking at. If it has historically meant something on this name, you can trade it with more confidence. If it has not, you just saved yourself a trade that was never really there. It takes about twenty seconds to run.
The Option Samurai SAR Backtest
How do you know if SAR has an edge on a stock? We built a backtest to measure it.
For each day in the sample, the backtest notes which SAR filters that day passed and what the stock did over the next ten trading days. Then it compares the average result after each signal with a benchmark. In our case: the average result after any day in the sample - in other words, what you would get by picking a day at random.
The difference between the two is the edge, in percentage points:
Edge = the signal's average 10-day move − the average 10-day move after any day
A positive edge means the stock did better than usual after the signal. A negative edge means the stock did worse than usual, even if the price still went up. This is why a bearish signal can "pass" while showing a positive return: what matters is whether the stock beat its own baseline, not whether it fell.
One thing to keep in mind: every day is either above or below the dots, so the bullish and bearish filters split the same history into two halves. If one half beat the baseline, the other half almost always trailed it.
A Bullish Example: Carvana (CVNA)
Type CVNA, pick Bullish, click “Run All” and you will get something like this:
CVNA, 2019-2026 | Days | % of time | Avg 10-day move | Median | % up | Spread | Edge |
|---|---|---|---|---|---|---|---|
Bullish | 1,025 | 53.1% | +5.41% | +2.88% | 58% | 21.18% | +2.16 |
Bearish | 897 | 46.4% | +0.77% | +1.32% | 53% | 20.36% | −2.47 |
Flipped to Bullish | 163 | 8.4% | +2.19% | +3.25% | 58% | 16.37% | −1.06 |
Flipped to Bearish | 163 | 8.4% | +1.18% | +2.57% | 57% | 16.62% | −2.07 |
Any day (baseline) | 1,922 | - | +3.25% | - | 56% | 20.92% | - |
The Edge column is the one that really matters in the table above. It shows how much better (or worse) the stock did after the signal than on a random day.
Carvana showed an edge while bullish, but not immediately when it first flipped bullish. You could interpret this idea as: perhaps opening a bullish trade immediately after the SAR turned bullish is not a smart idea on CVNA. Entering an established upward trend, instead, may be a better move.
The chart below is what you would actually get from our free backtest: you can see that bullish cases actually gave you an edge on CVNA on average (the blue line is above the dashed one). We’ve also added the 75% confidence interval (the blue area) to give you a better idea of the risk at stake.
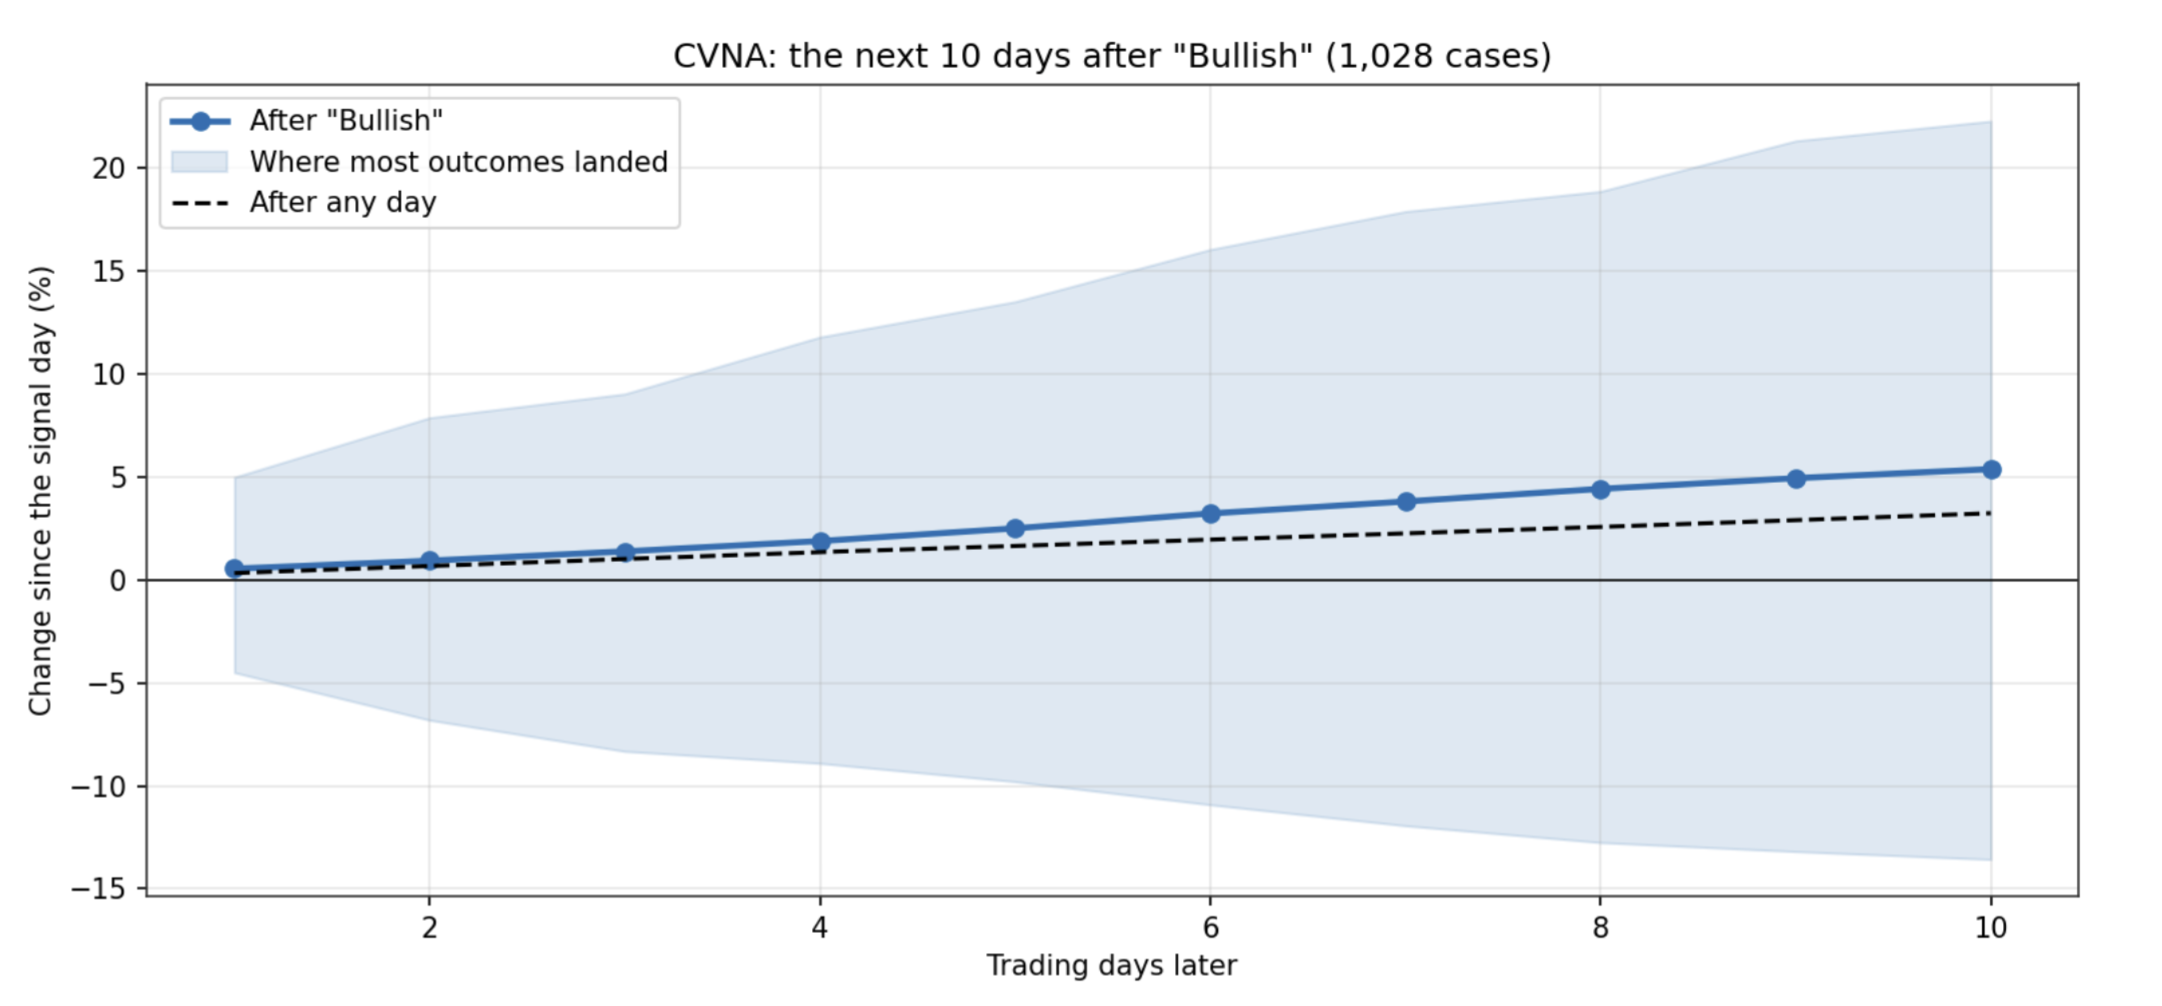
The edge also held up when we re-ran the test with different SAR settings and on different halves of the sample.
A Bearish Example: Tesla (TSLA)
Tesla shows what a bearish edge usually looks like in a stock that spent years going up:
TSLA, 2019-2026 | Days | % of time | Avg 10-day move | Median | % up | Spread | Edge |
|---|---|---|---|---|---|---|---|
Bullish | 1,021 | 52.8% | +3.27% | +1.21% | 53% | 13.93% | +0.95 |
Bearish | 901 | 46.6% | +1.25% | +1.86% | 55% | 12.78% | −1.08 |
Flipped to Bullish | 152 | 7.9% | +1.69% | −0.97% | 48% | 13.22% | −0.63 |
Flipped to Bearish | 149 | 7.7% | −1.25% | −0.54% | 49% | 11.12% | −3.57 |
Any day (baseline) | 1,922 | - | +2.32% | - | 54% | 13.44% | - |
Again, focus on the “Edge” column. It shows how much better or worse the stock did after the signal than on a random day.
Simply put: below the dots, Tesla kept rising, but less than usual. The bearish signal passes with an edge of −1.08 points not because the stock fell, but because it stopped beating its own average.
A result like this calls for a relative trade, such as a spread that profits if the stock stops rallying, rather than an outright short. The stock did not reliably fall.
One More Lesson: Compare the Average With the Median
Two quick examples make the point.
- Citigroup's "Flipped to Bullish" signal shows an edge of +1.38. The average 10-day move was +2.22% and the median was +2.25% - almost the same number - and 63% of windows finished green against a 57% baseline. No lucky outlier is doing the work.
- GameStop's same signal shows an edge of +8.51, six times bigger. But its average move of +13.60% sits on top of a median of −0.79%, and fewer than half the windows finished green. A handful of enormous winners from 2021 carries the whole result.
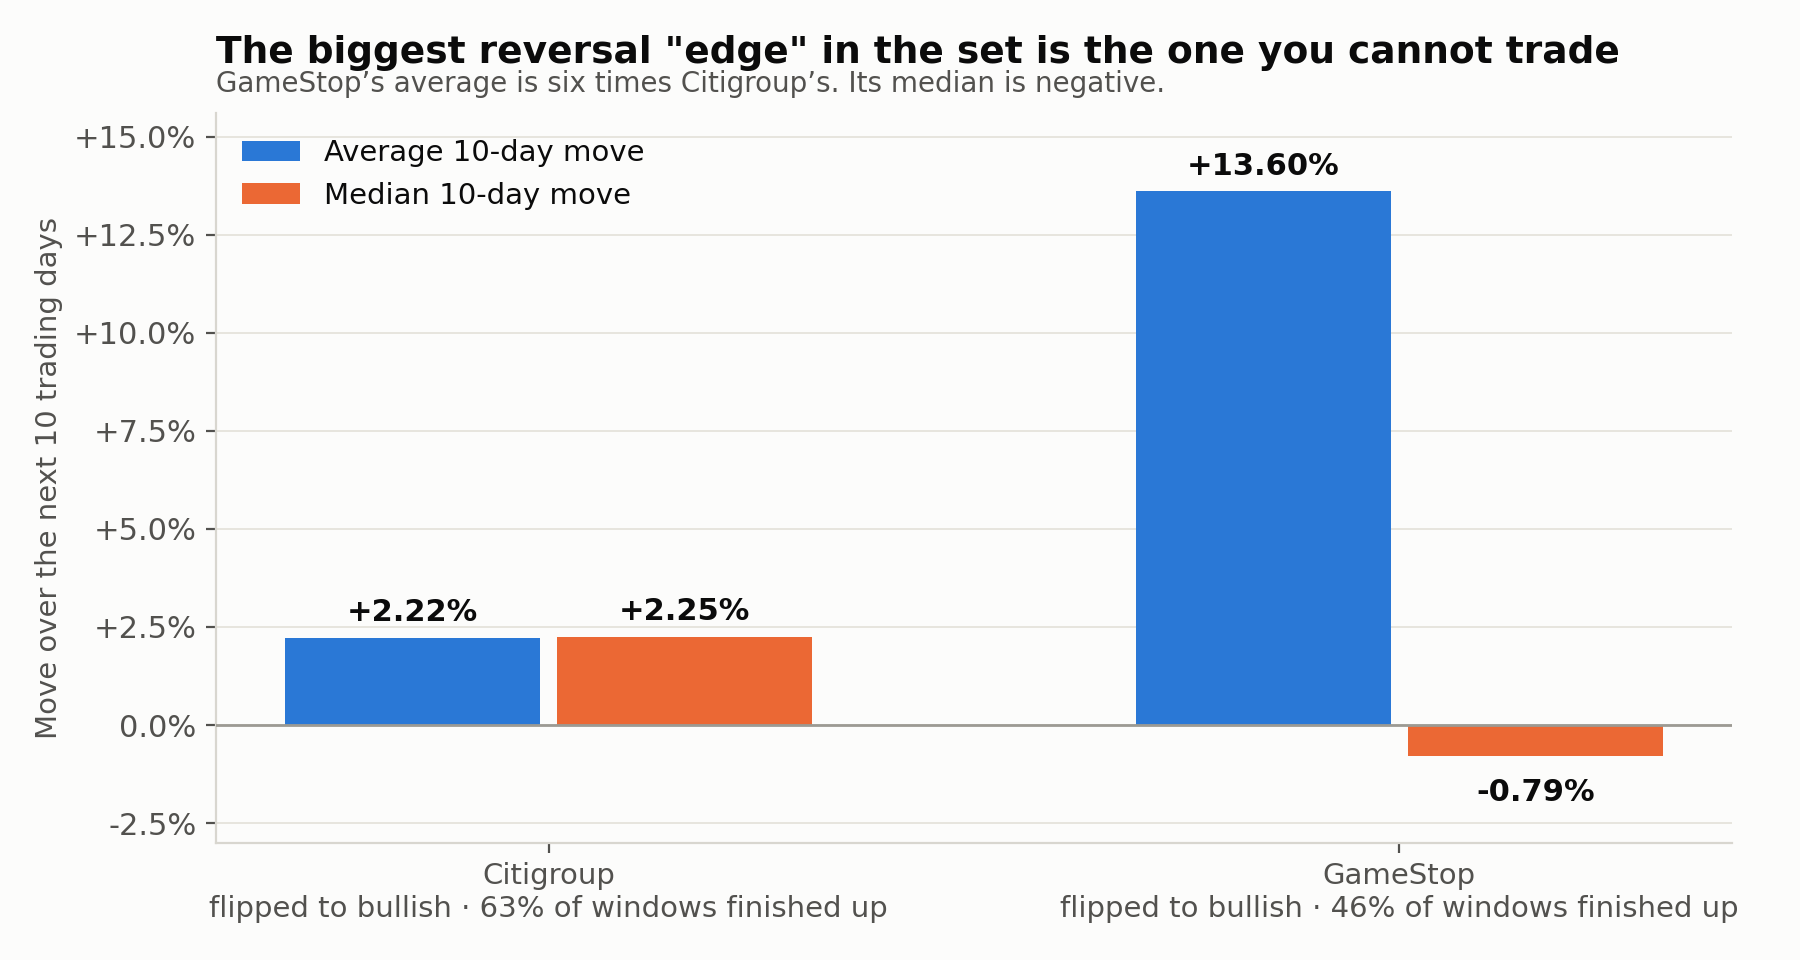
Same indicator, same filter, two very different trades. Citigroup's flip has behaved like a steady pattern. GameStop's is a lottery ticket. The backtest also shows that the trend signal and the flip signal are different trades. Carvana pays for the trend but not for the turn; Citigroup is the opposite. So the question is never "does SAR work on this stock." It is "which SAR signal works on this stock," and the answer changes name by name.
Your Checklist Before Trading a SAR Signal
- Count the real reversals, not just the signal days. Fewer than about 50 and you are mostly reading noise.
- Look at the edge, not the raw return. A signal can show a positive return and still be worse than a random day.
- Compare the average with the median. If they disagree, a few big outliers are driving the result.
- Compare the trend filter with its flip twin. Only one of them may work on your stock.
- Try different SAR settings. A real edge should not flip sign when the settings change.
- Split the sample in two. The edge should exist in the recent half, not only in the old one.
If a stock clears all six checks, go back to the scanner and build the actual trade. The SAR filter sits alongside IV rank, liquidity and expected return, so you can go from "the signal works on this name" to "here is the trade" without leaving the page.
Run Your Own Backtest
AUTHOR
 Gianluca LonginottiFinance Writer - Traders Education
Gianluca Longinotti is an experienced trader, advisor, and financial analyst with over a decade of professional experience in the banking sector, trading, and investment services.
REVIEWER
 Leav GravesCEO
Leav Graves is the founder and CEO of Option Samurai and a licensed investment professional with over 19 years of trading experience, including working professionally through the 2008 financial crisis.