
Credit Spread Ladder - How to Build a Routine Instead of a Launch Day
Published on November 4, 2026 | 7 min readTable of Contents
- Key Takeaways
- What Is a Credit Spread Ladder?
- The Building Block: A Bull Put Spread Example
- How a Credit Spread Ladder Works Over Time
- The Rules a Spread Must Pass Before It Joins the Ladder
- Finding Ladder Candidates With Option Samurai
- How to Diversify a Credit Spread Ladder
- The Weekly Review: Hold, Close or Roll
- Margin and Leverage on a Credit Spread Ladder
Reviewed by Leav Graves
Table of Contents
- Key Takeaways
- What Is a Credit Spread Ladder?
- The Building Block: A Bull Put Spread Example
- How a Credit Spread Ladder Works Over Time
- The Rules a Spread Must Pass Before It Joins the Ladder
- Finding Ladder Candidates With Option Samurai
- How to Diversify a Credit Spread Ladder
- The Weekly Review: Hold, Close or Roll
- Margin and Leverage on a Credit Spread Ladder
Many traders who sell credit spreads open them all on the same day, with no diversification across time. Every trade then starts from one price, one volatility reading and one expiration date. If that day turns out to be a bad one, the whole account feels it. A credit spread ladder fixes the timing part. You open spreads one at a time, on different dates, and you know the worst case of each trade before you enter. Here is how the trade works, how to schedule it, the rules to follow and the risks to watch.
KEY TAKEAWAYS
- A credit spread ladder is a series of credit spreads that you open on different dates, for example, one every two weeks, instead of opening them all at once.
- Decide how many spreads to open based on the max loss, not the premium collected. Have a business reason for each trade, not just a short-term technical signal like RSI.
- A ladder diversifies your entry dates. It does not make any single spread less risky, so pick good stocks, mix sectors and check trades weekly.
What Is a Credit Spread Ladder?
A credit spread ladder is a pre-defined routine of opening new credit spreads at regular intervals, such as every two weeks. Each spread has its own entry date and expiration date, so as one expires, the next one is already in place.
Why opening everything on one day is risky
When you open all your spreads in one session, it is based on that session's prices and implied volatility, and every trade expires together. If that session is a bad entry point, every trade will drag down your P&L. On the other hand, if you spread your entries across different dates, you can control the damage.
The Building Block: A Bull Put Spread Example
In a credit spread, you sell one option and buy a cheaper one of the same type and expiration, for a net credit. In a bull put spread, you sell a put and buy a lower-strike put, which caps your loss if the stock falls hard. A bear call spread does the same with calls.
A real bull put spread on AAPL
This trade comes from the Option Samurai scan shown later, with AAPL trading at $331.90:
- Sell the January 15, 2027 310 put
- Buy the January 15, 2027 300 put
- 72 days to expiration
This is what the trade above would look like:
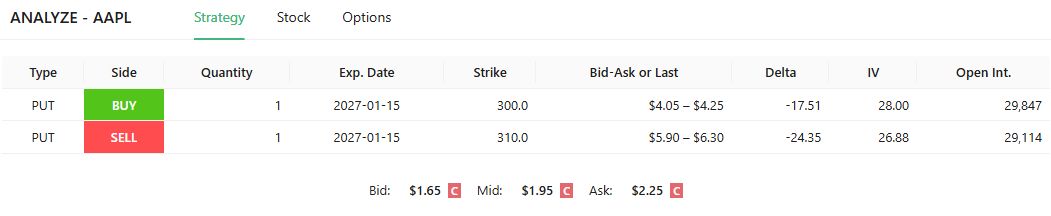
The scanner estimates a net credit of $1.80, or $180 per spread. That is your maximum profit, kept if AAPL closes at or above $310 at expiration. The panel shows a $1.95 mid price, but by default the scanner assumes a more conservative fill: 25% of the way from the $1.65 bid toward the $2.25 ask.
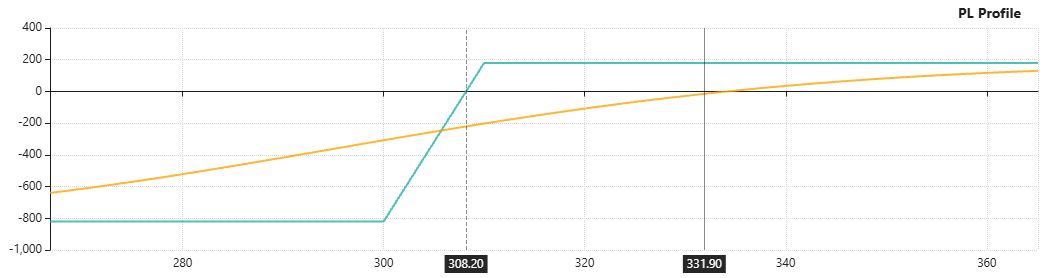
So, as you can see in the P&L chart above, these are the main numbers you should focus on:
- Breakeven: $310 - $1.80 = $308.20, about 7.1% below the stock price
- Maximum loss: ($310 - $300 - $1.80) x 100 = $820
- Probability of max profit: 73.20%, a theoretical estimate
Selling the 310 put alone would bring in about $600, but its worst case is about $30,400 if AAPL went to zero. The 300 put costs about $420 of that premium, and in return your worst case is $820, known upfront. Your real fill may differ from the scanner's estimate.
How a Credit Spread Ladder Works Over Time
The ladder turns one trade into a routine. For instance, you could open a new spread every other week. Opening one every week can push you into trading just because it is Monday. Treat the two-week interval as an example and pick one you can keep.
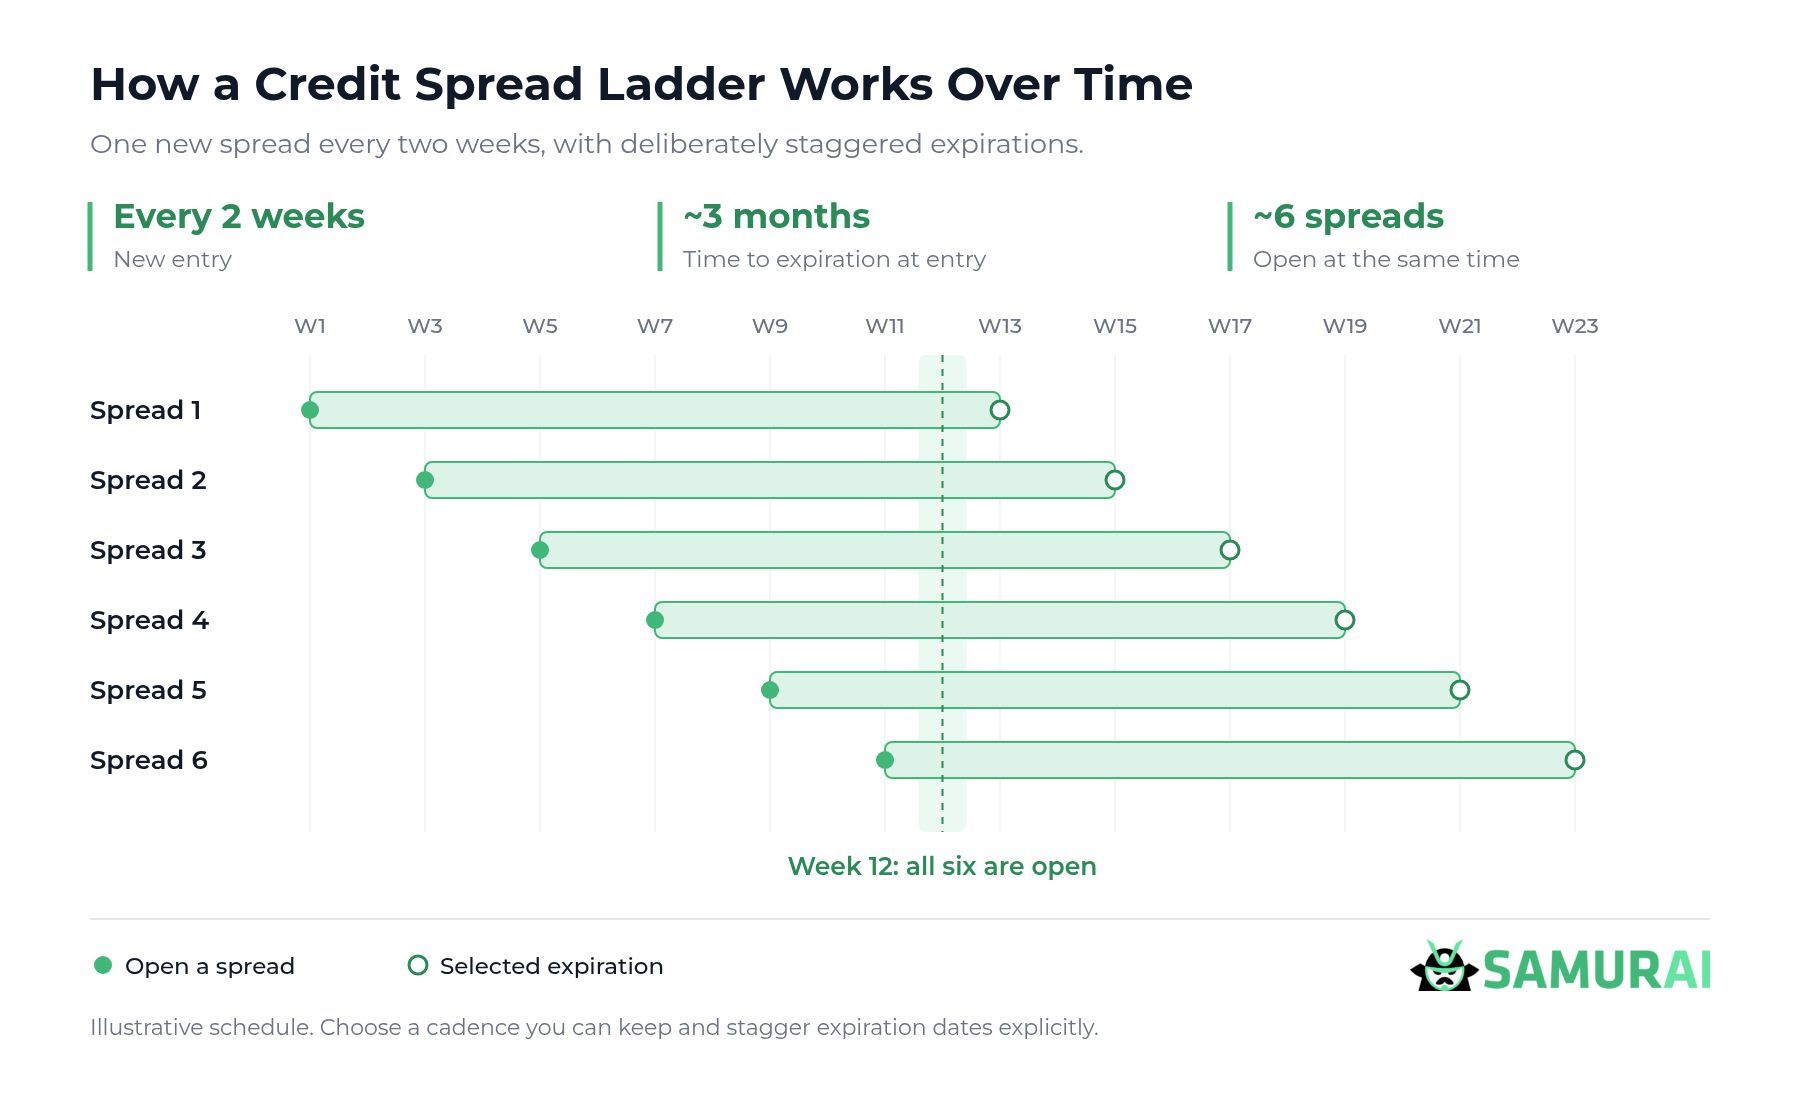
With a three-month expiration, that works out to about six spreads open at once, each with its own start and expiration date.
Entry frequency, expiration and open spreads
To estimate how many spreads are open, divide the weeks to expiration by the weeks between entries. With a new spread every two weeks:
Time to expiration | Spreads open at once |
|---|---|
3 months | About 6 |
6 months | About 13 |
12 months | About 26 |
The same routine can tie up very different amounts of money, so choose the horizon and the trade size together.
The Rules a Spread Must Pass Before It Joins the Ladder
Before a spread joins the ladder, it should pass three rules. Treat the numbers as examples to adjust to your own risk. They don't promise a profit, but they give every spread the same starting point.
- Short strike around 20 to 30 delta: Delta is a rough guide to the chance an option finishes in the money. A short put at 20 to 30 delta lines up with roughly a 70% to 80% theoretical probability of profit. A short strike closer to the stock price pays more, but you are wrong more often. The AAPL 310 put sits at about 24 delta (-24.35 in the panel).
- Size by maximum loss, not credit: Keep any single trade at no more than 5% to 10% of the account, measured by maximum loss. In a $20,000 account, 5% is $1,000, enough for one AAPL spread ($820). 10% is $2,000, enough for two ($1,640). Now add the ladder: one spread per entry, and six entries open is $4,920 at risk, about 25% of the account.
- Start with a fundamental reason, then use RSI for timing: RSI (Relative Strength Index) shows when a stock has moved too far, too fast. That matters for days, not months, and a three-month spread will probably sit through an earnings report. Start with a business reason, such as growing earnings after a price drop, then use RSI to pick the entry day.
Finding Ladder Candidates With Option Samurai
Here is a bull put spread scan you could build for this routine. Consider it a starting point and adjust it to your own risk tolerance:
- Days to expiration: 70 to 100
- Probability of max profit: above 70%
- Max loss: below $1,000
- Total option volume: above 5,000, for liquidity
- IV rank: above 20, for a little edge when selling options
- Moneyness: -25% to 0, the scanner's default for this strategy
On the scanner, this is what it looks like:
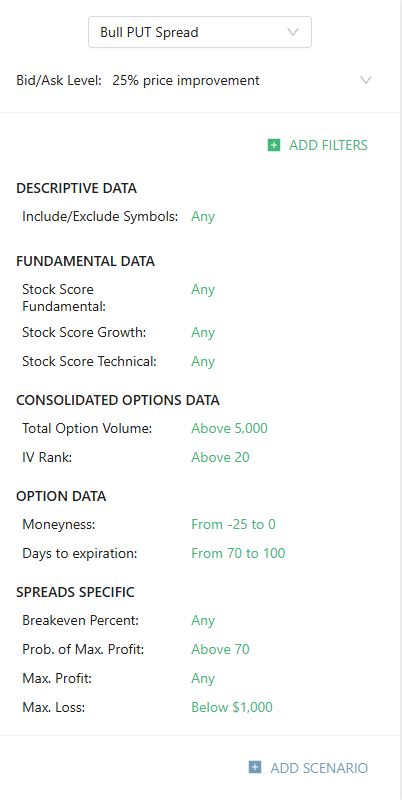
We also added max profit and breakeven as columns and sorted by total option volume, then by probability of max profit (lowest first), so each ticker shows its spread closest to 70%.
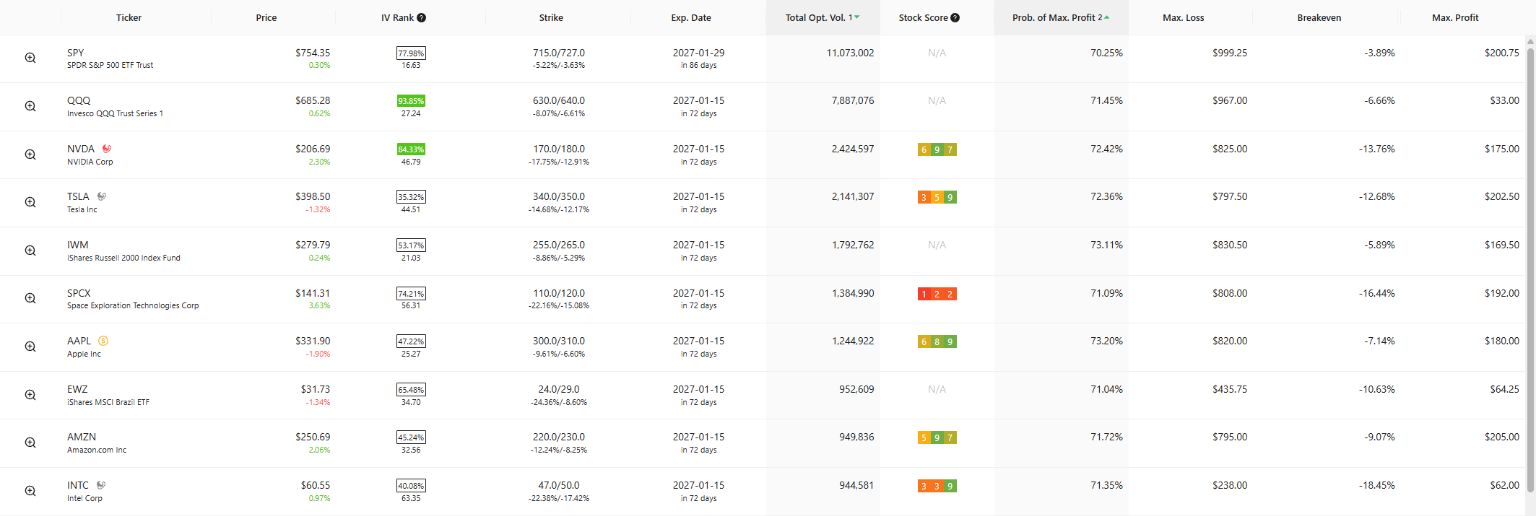
Treat the probability as a guide. It is calculated from option prices using the Black-Scholes model, so it reflects what the market is pricing in, not a forecast for the stock. It doesn't account for ticker-specific scenarios, such as an earnings miss or a sector sell-off, so that the real odds can be better or worse. Divide your risk limit by the max loss to get the number of spreads, and check the company before trading. The same scan works for bear call spreads.
How to Diversify a Credit Spread Ladder
You can use two approaches when building your credit spread ladder routine:
- Bullish only: bull put spreads on companies you would be happy to own. It is simpler and a good place to start.
- Both sides: add bear call spreads on companies you think are weak or have run too far. The portfolio gets closer to neutral, but you'll need to rebalance its overall delta from time to time.
Then diversify by time, which the ladder already gives you, by direction, if you trade both sides, and by sector. Six spreads on chip stocks are one trade, six times.
A bullish and bearish credit spread on the same stock and expiration will be equivalent to an iron condor, which is a different trade from the ladder.
The Weekly Review: Hold, Close or Roll
Pick one day a week and ask one question about each spread: is my original reason still valid?
When the spread is working
Say a spread has earned more than 50% of its original credit, with plenty of time left. For the AAPL trade, that means buying it back for $0.90 or less, keeping at least $90 of the $180. If you are no longer convinced, close it. If you are still bullish, you can roll up and out to a higher strike and a later date.
When the price crosses the short strike
If you are still bullish, you can roll down and out to a lower strike and a later date. If your view of the company changed, close and move on. Rolling is not an automatic fix. It closes the current spread, which can lock in a loss, and opens a new one with new risk, so it must pass the same rules as any new trade.
Margin and Leverage on a Credit Spread Ladder
Margin is the collateral your broker holds while a trade is open. In general, a standard margin account holds a credit spread's full maximum loss: for the AAPL trade, the $1,000 strike width minus the $180 credit, or $820.
Accounts with risk-based margin, such as portfolio margin, work differently. There, a long-dated, out-of-the-money spread can start with a requirement below its maximum loss. That gap is leverage, and it could fund trades on more tickers. Rules differ by broker, account type and country, so check yours first.
Why risk-based margin can change
Risk-based margin is recalculated as the stock price, implied volatility, and time to expiration change. It can rise when the price moves against you or volatility climbs. Late in the trade, when the price nears your short strike, it can approach the maximum loss, which is when a margin call can force you out. Size for margin at its peak, not at entry.
AUTHOR
 Gianluca LonginottiFinance Writer - Traders Education
Gianluca Longinotti is an experienced trader, advisor, and financial analyst with over a decade of professional experience in the banking sector, trading, and investment services.
REVIEWER
 Leav GravesCEO
Leav Graves is the founder and CEO of Option Samurai and a licensed investment professional with over 19 years of trading experience, including working professionally through the 2008 financial crisis.