

Gianluca Longinotti is an experienced trader, advisor, and financial analyst with over a decade of professional experience in the banking sector, trading, and investment services. Known for his rigorous approach and deep understanding of market dynamics, Gianluca specializes in derivatives and cyclical analysis, with a strong emphasis on options trading strategies and macroeconomic frameworks.
Gianluca is the founder of Cycle Quest, a project focused on applying cyclical models to financial markets, economic indicators, and more. With an international academic background and a passion for data-driven decision-making, Gianluca empowers traders and investors with expert insights, clear strategy frameworks, and cutting-edge tools.
Education
- Bachelor’s Degree in Economics from University of Brescia (Italy)
- Two Master’s Degrees in Economics and Empirical Finance from Sorbonne University (France)
References
- Founder at Cycle Quest
- Contributor at Traders Union
- Author at Tokize.com
- Author at Crypto Adventure
Experience
- Over a decade of experience trading options, with a focus on defined-risk strategies such as vertical spreads, iron condors, and diagonals
- Deep understanding of options pricing models like Black-Scholes and binomial trees, applied daily to position evaluation
- Active user of the CBOE indices as a benchmark to build and test different trading strategies with options
- Expert in managing trades using the Greeks (Delta, Theta, etc.) to dynamically adjust risk
- I regularly post live trade setups and market reads on Gianluca’s Trades via the Option Samurai blog and my personal Stocktwits profile
- Skilled in building algorithmic strategies in Python and Pine Script, with a focus on short-term price action and event-driven plays
- Creator of backtesting environments tailored to options logic using Python’s Pandas and NumPy stack
- Daily use of TradingView, Interactive Brokers, and Databento for execution, charting, and data analysis
- Developed custom automated dashboards in Plotly and Streamlit for real-time tracking of trade performance and volatility curves
- Frequently design strategies aligned with FOMC and macroeconomic indicators for directional and volatility bias
- Strong foundation in fundamental analysis, with deep dives into financial statements and earnings behavior
- Implemented statistical arbitrage and volatility modeling techniques to detect mean-reverting edges
- Experienced in handling expiration risk, assignment logic, and optimizing trade timing around options cycles
- Advocate for integrating behavioral finance principles to mitigate biases and improve trader discipline
- Regularly consult with traders on strategy design, risk control, and automation to elevate their performance across market regimes
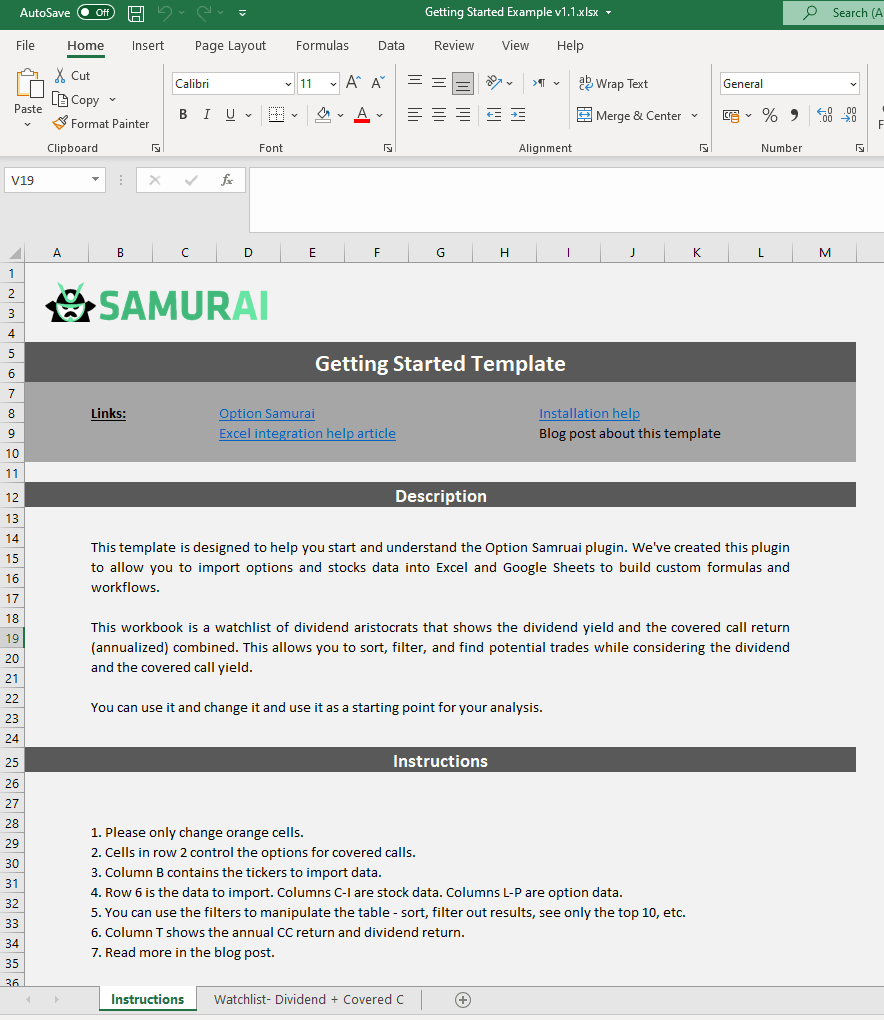
Excel template: Good covered calls trades on Dividend Aristocrats
4 min read
We've recently launched our new Excel and Google Sheet integration with Option Samurai. It allows you to import options data directly from our options scanner to Excel and Google Sheets. This...

Options data in Excel & Google Sheets
4 min read
Excel is a powerful tool that allows you to build custom workflows and advanced analytics to generate an edge in the markets. However, maintaining the excel sheets and keeping the data up-to-date...

Tip: Use Scans as Part of Your Investment Process
3 min read
This article will be a short technical how-to article to help you create scans for your investing process. We use it personally to quickly access our scans in our daily routines, save time, and...
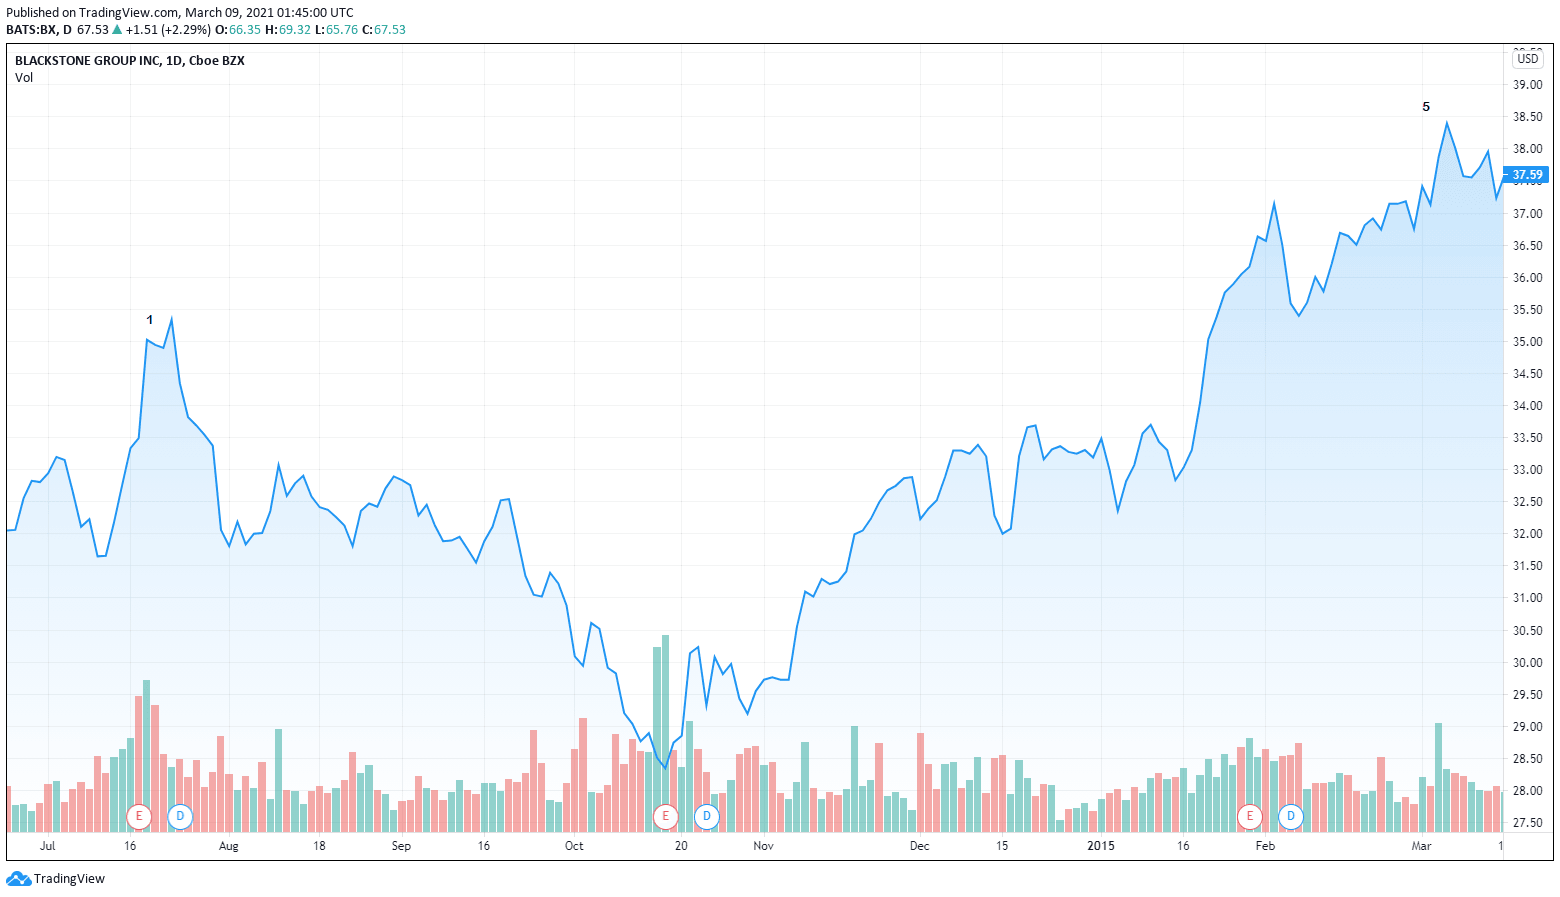
Lowering Cost Basis with Options (With a trade example)
4 min read
In this post, I wish to talk about lowering the cost basis of a position. I will do that by showing a trade that didn't go so well but still showed a profit because I managed to lower my cost...
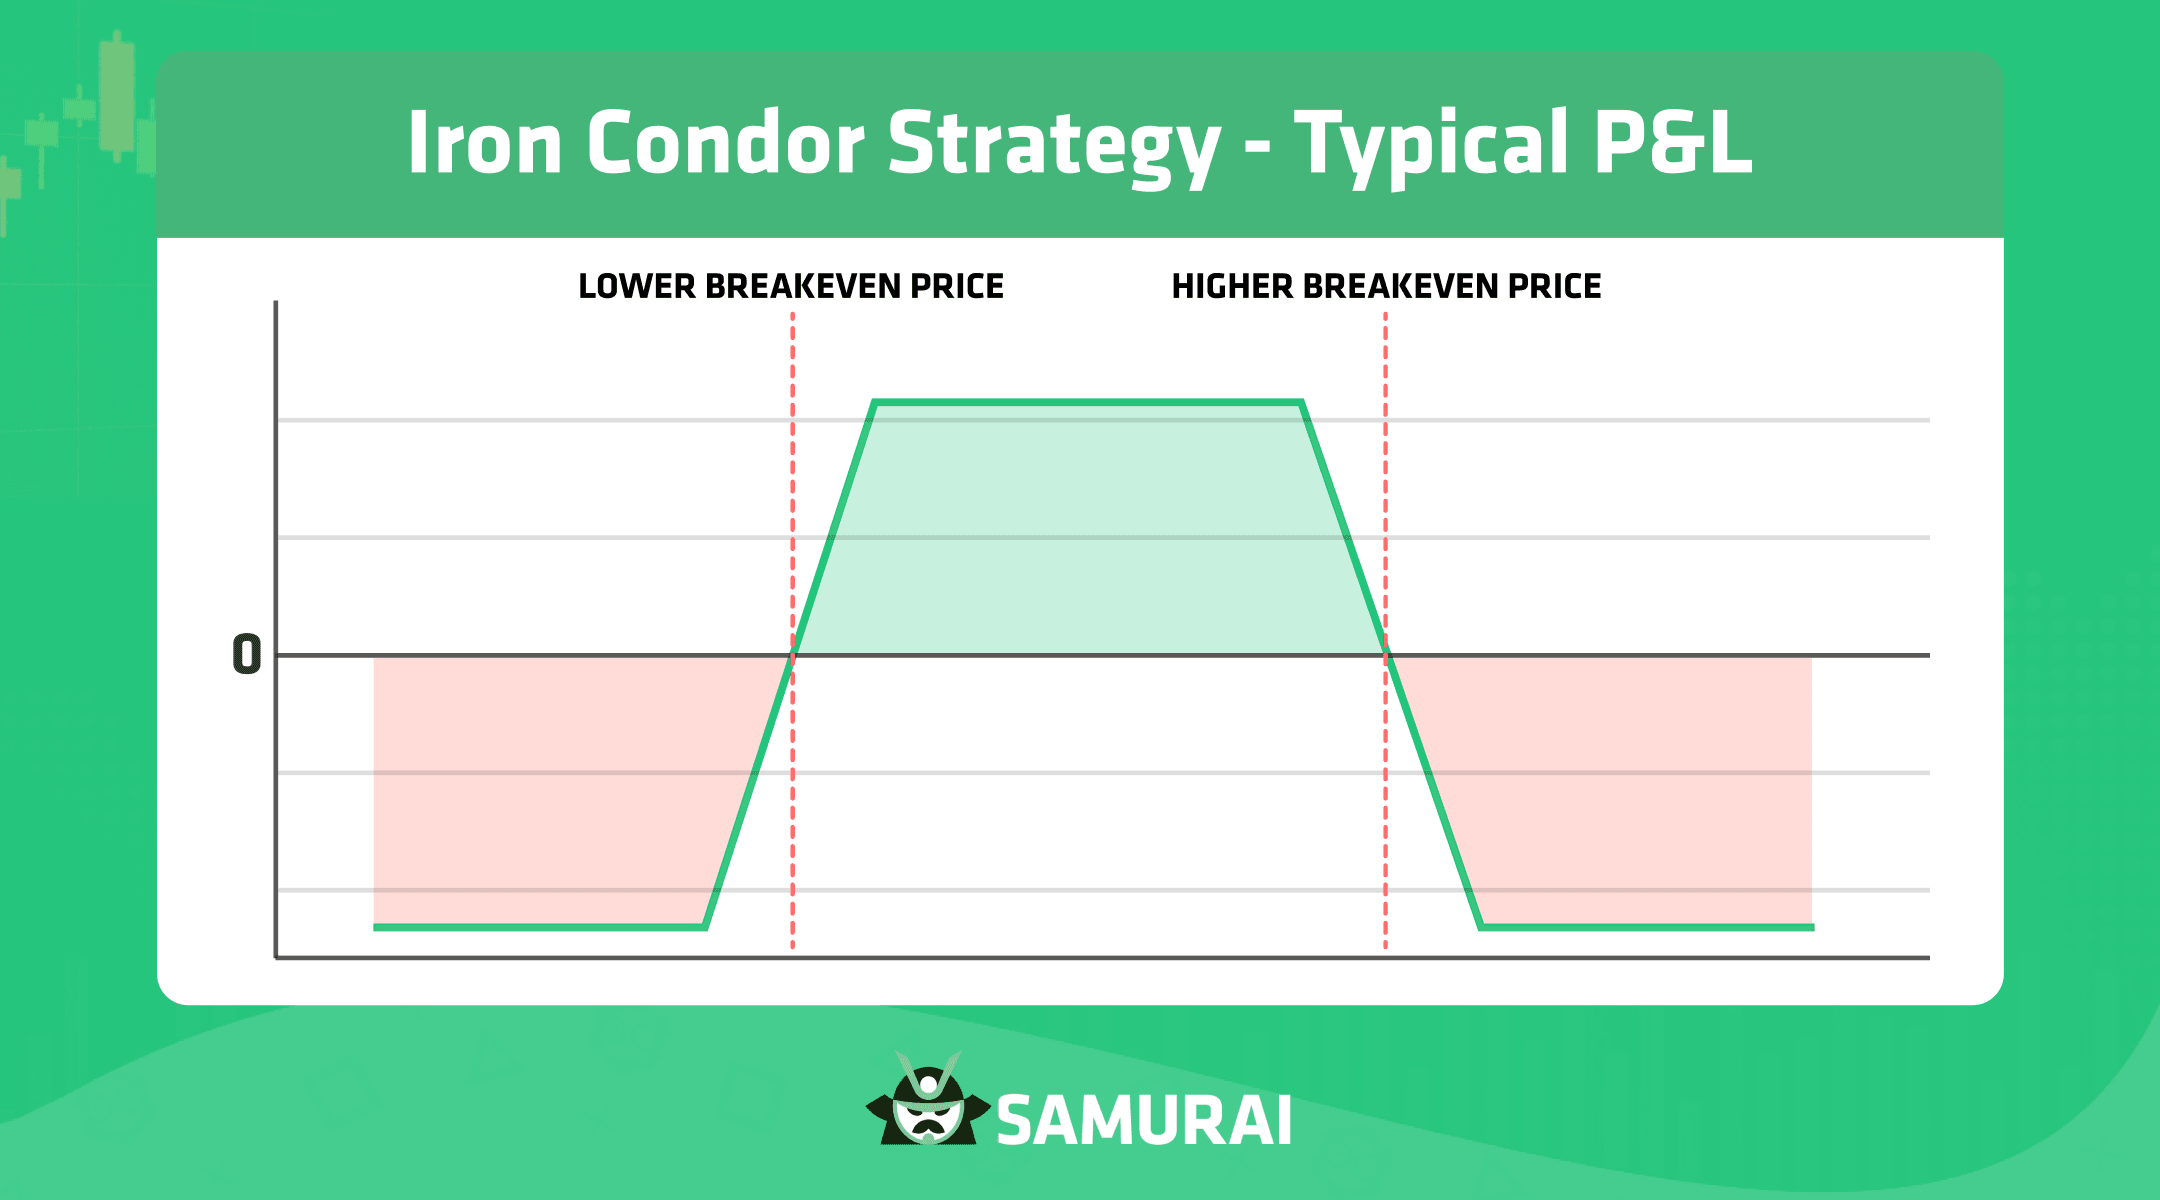
Optimal Iron Condor Strategy and how to find it in Option Samurai
9 min read
Today we will discuss one of the most popular strategies in options trading: iron condor. The Strategy became very popular due to the limited risk profile while maximizing the time value derived...
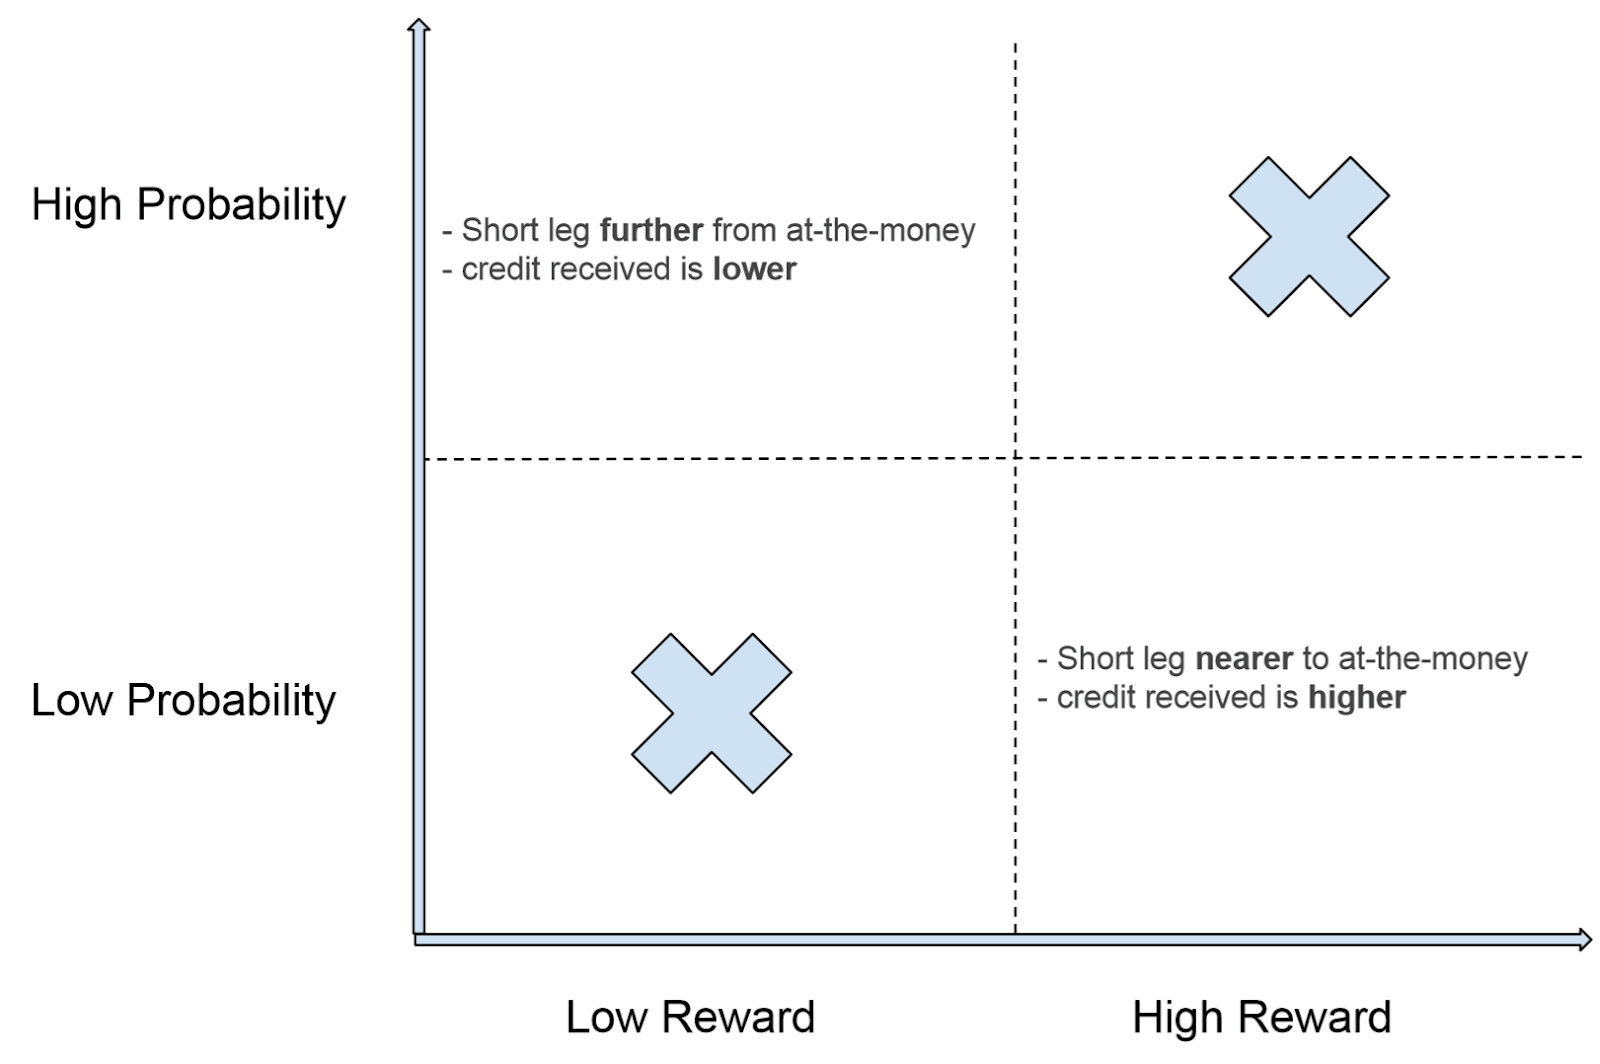
Creating an optimum vertical spread
11 min read
Update: This article describes what vertical spreads are, considerations on how to build optimal spreads, data points to take into considerations, how to find your comfort zone, and more. Feel free...
![YEbmlpTbOnfjlVcdSneo_image1[1]](/_next/image/?url=%2Fapi%2Fmedia%2Ffile%2FYEbmlpTbOnfjlVcdSneo_image11.png&w=3840&q=90)
Stock Score Analysis
8 min read
When trading options, we often focus on option specific data points such as IV, time decay, volatility, the Greeks, etc. These are essential measures that are unique to the options realm. However,...
![Focusing[1]](/_next/image/?url=%2Fapi%2Fmedia%2Ffile%2FFocusing1.png&w=3840&q=90)
Implied Volatility Backtest 2: Predicting RV Change
4 min read
This is a multiple-article series. In part one, Implied Volatility backtest – Predicting IV Change, we discussed how the IV percentile predicts future IV change. In this article, we will test how...
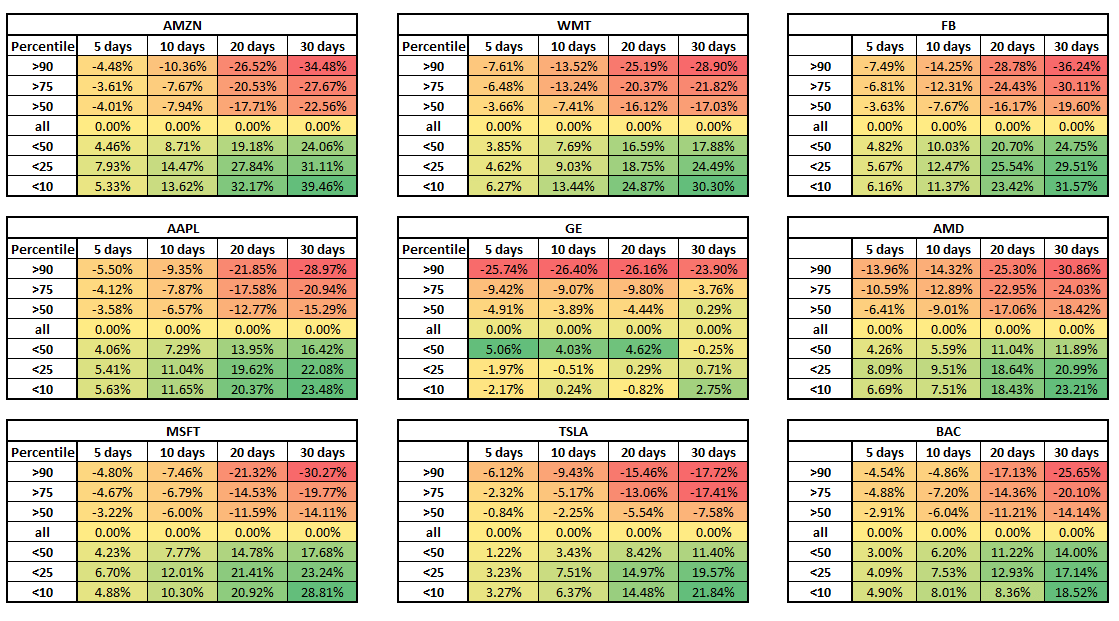
Implied Volatility backtest - Predicting IV Change
5 min read
[We have just added another article in the series, about the Real Volatility (or Historical Volatility) backtest. Check it at Implied Volatility Backtest 2: Predicting RV Change]
We've often...
![IV-Rank-Vs-Percentile[1]](/_next/image/?url=%2Fapi%2Fmedia%2Ffile%2FIV-Rank-Vs-Percentile1.jpg&w=3840&q=90)
Difference between IV Rank & IV Percentile
2 min read
In the OptionSamurai Scanner, we use IV Percentile to compare the IV of different stocks and call it “IV rank” as we think it is more intuitive to understand. We know that other market players...
Try our option scanner FREE for 14 days with no obligation
FIND TRADES NOW