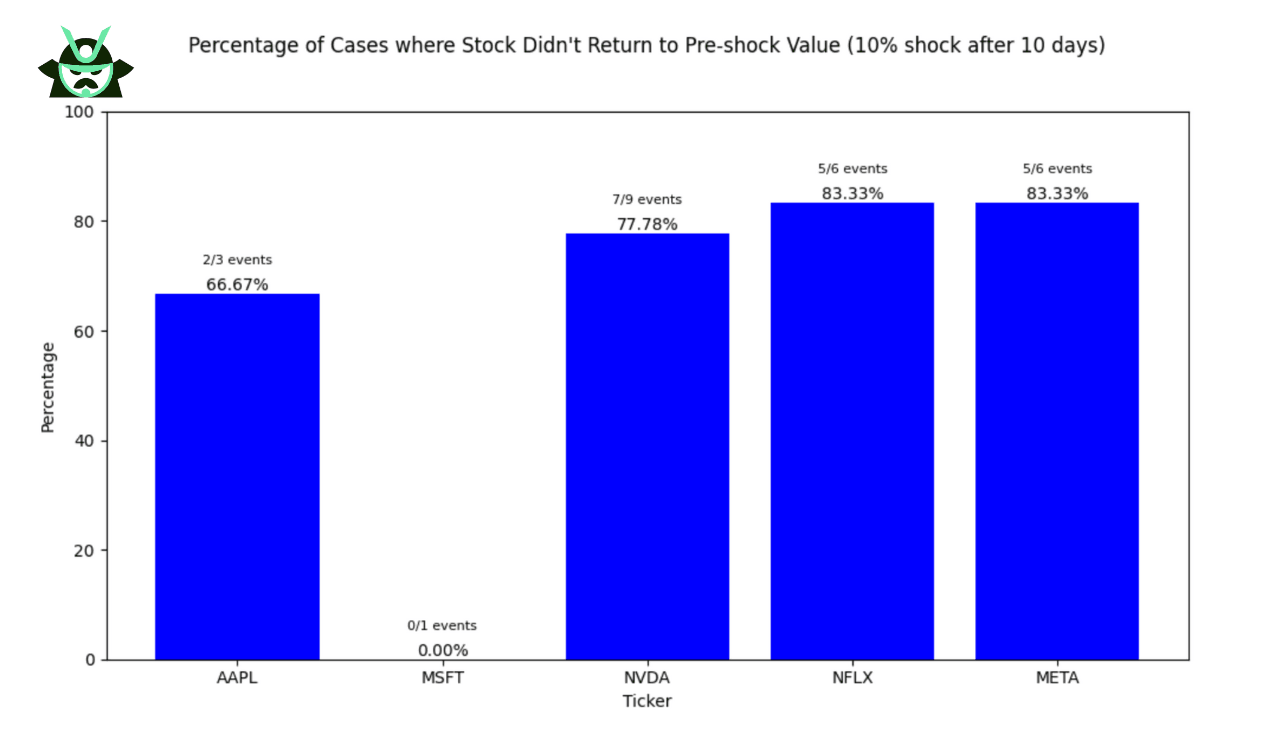
Backtesting the ADX Filter on Any Stock [Free Backtest File]
10 min read
See what ADX sideways, bullish and bearish readings actually did on a stock over the next two weeks, and how to spot a false edge. Free backtest file inside.

3 min read
A bear call spread on NOW: short $172 call, long $182 call to cap the loss at $971. RSI 74, no earnings before expiry, 17% buffer to the short strike.
2 min read
A bearish capped risk reversal on JPM: short $367.5 call, long $380 call to cap losses, long $295 put for downside. Small credit, defined risk, negative delta.
2 min read
Selling a naked put on NVDA: $170 strike, Aug 2026 expiry, ~55% IV rank. Breakeven at $168.44, with a plan to close well before expiration.

6 min read
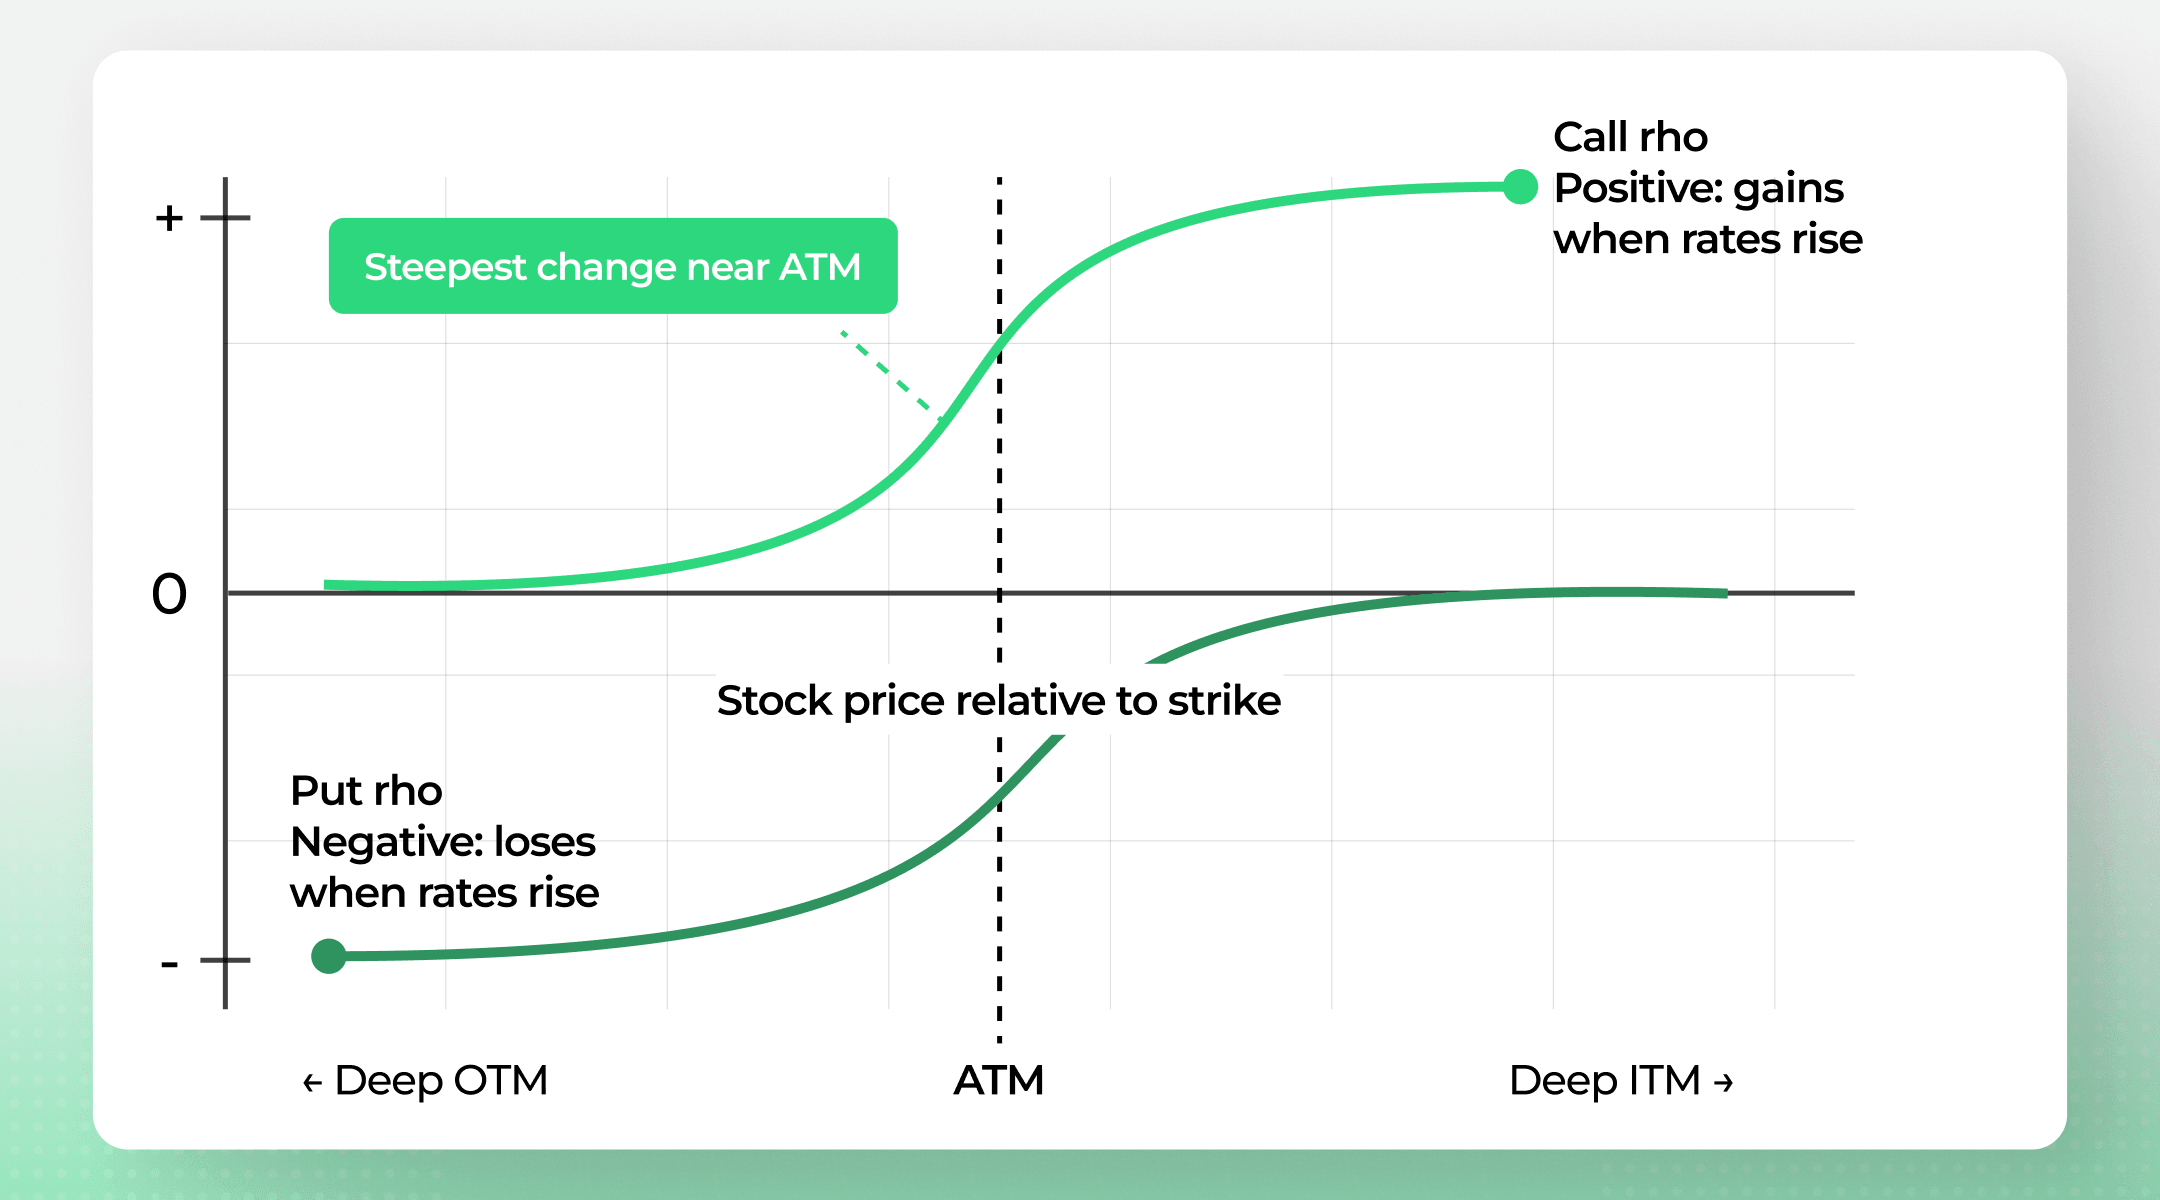
Learn what rho means in options trading, how interest rates affect option prices, and when rho matters most. Explained with clear examples for calls and puts.

7 min read
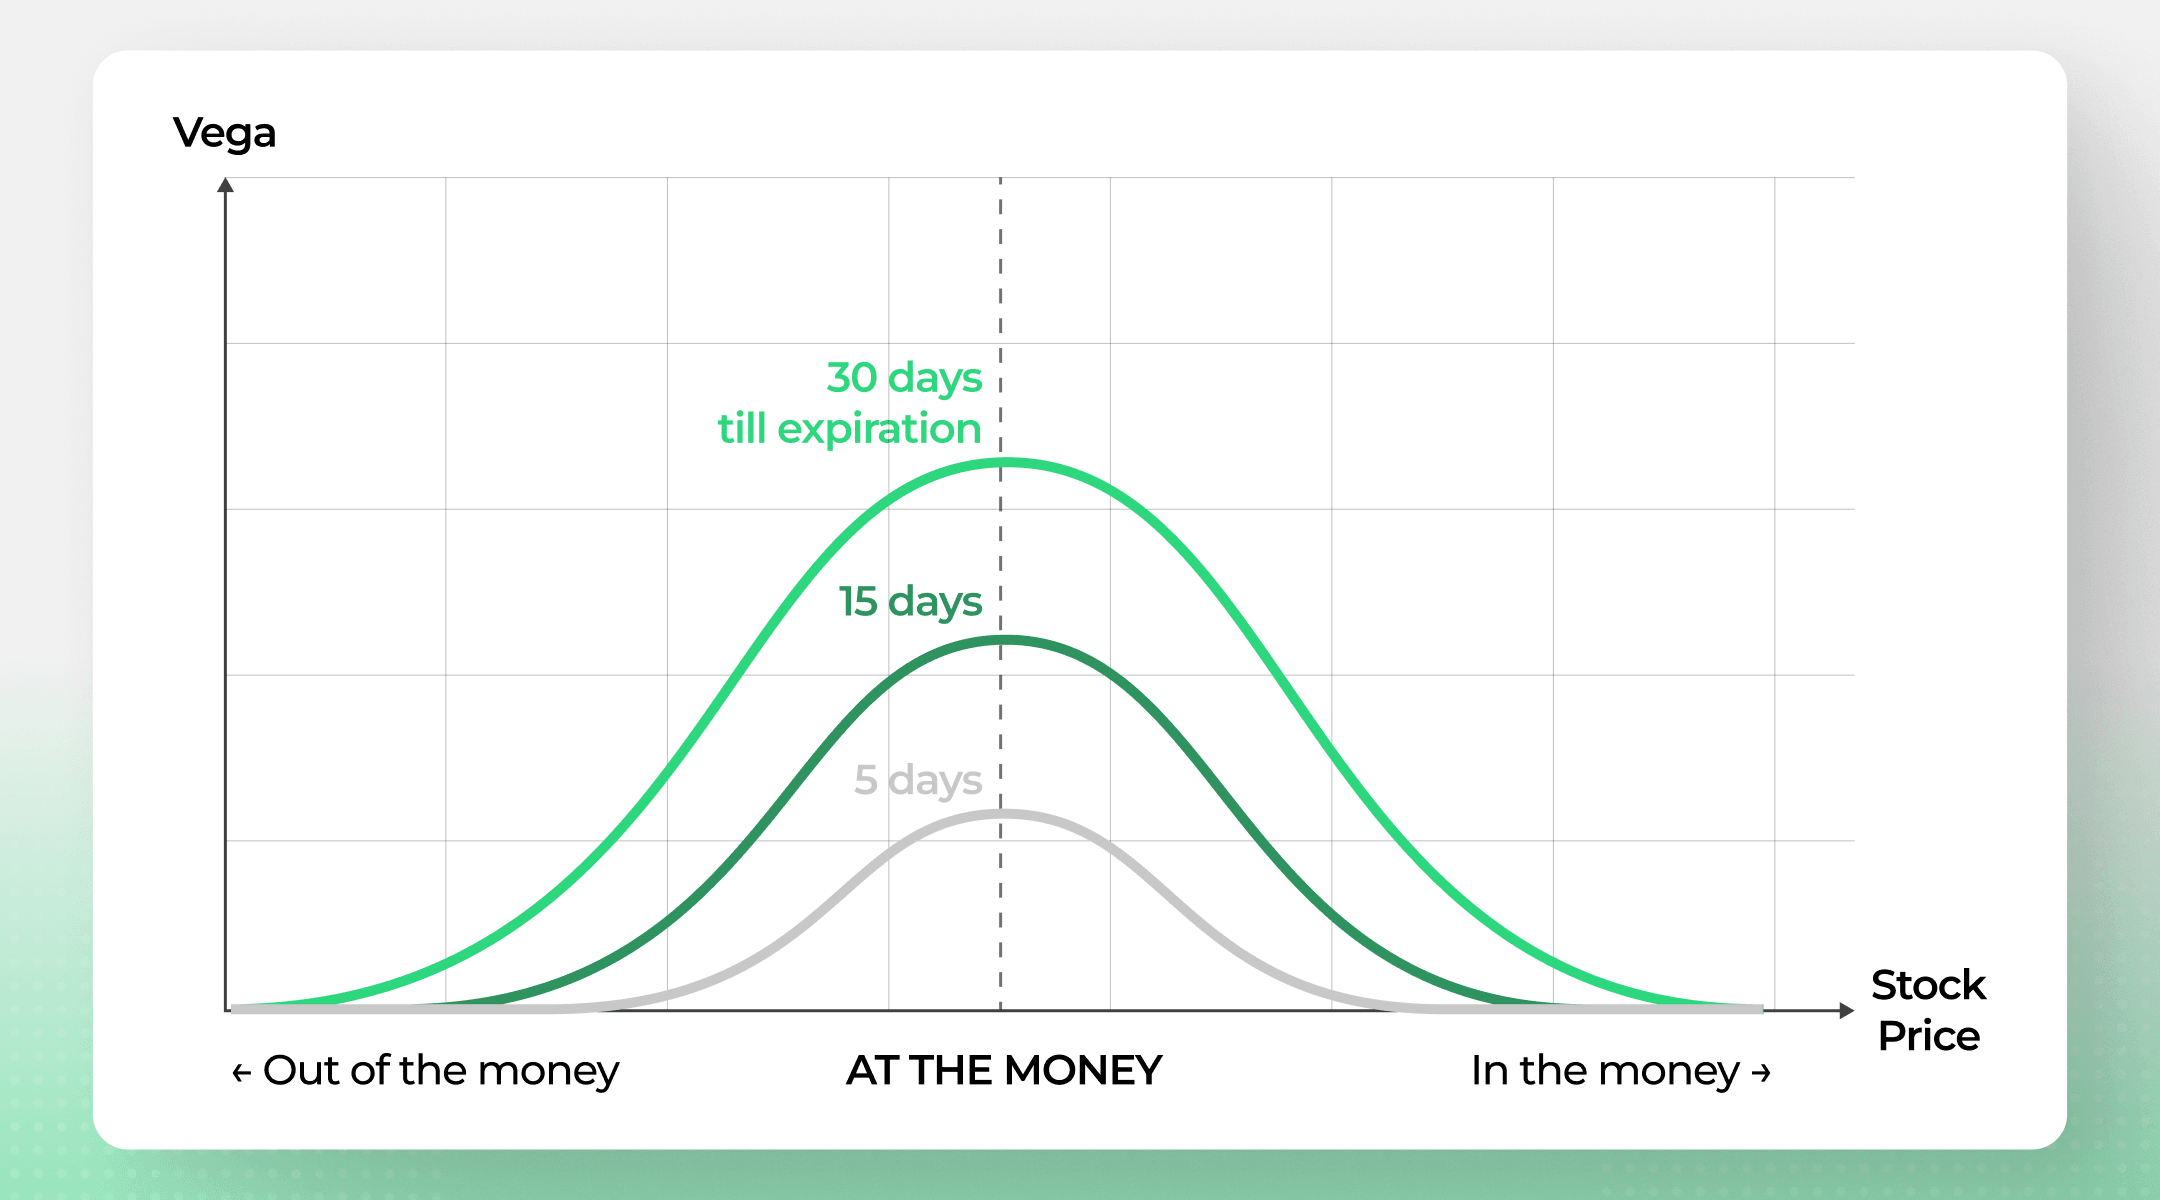
Learn what vega means in options trading, how implied volatility affects option prices, and how to use vega for long and short strategies.

6 min read
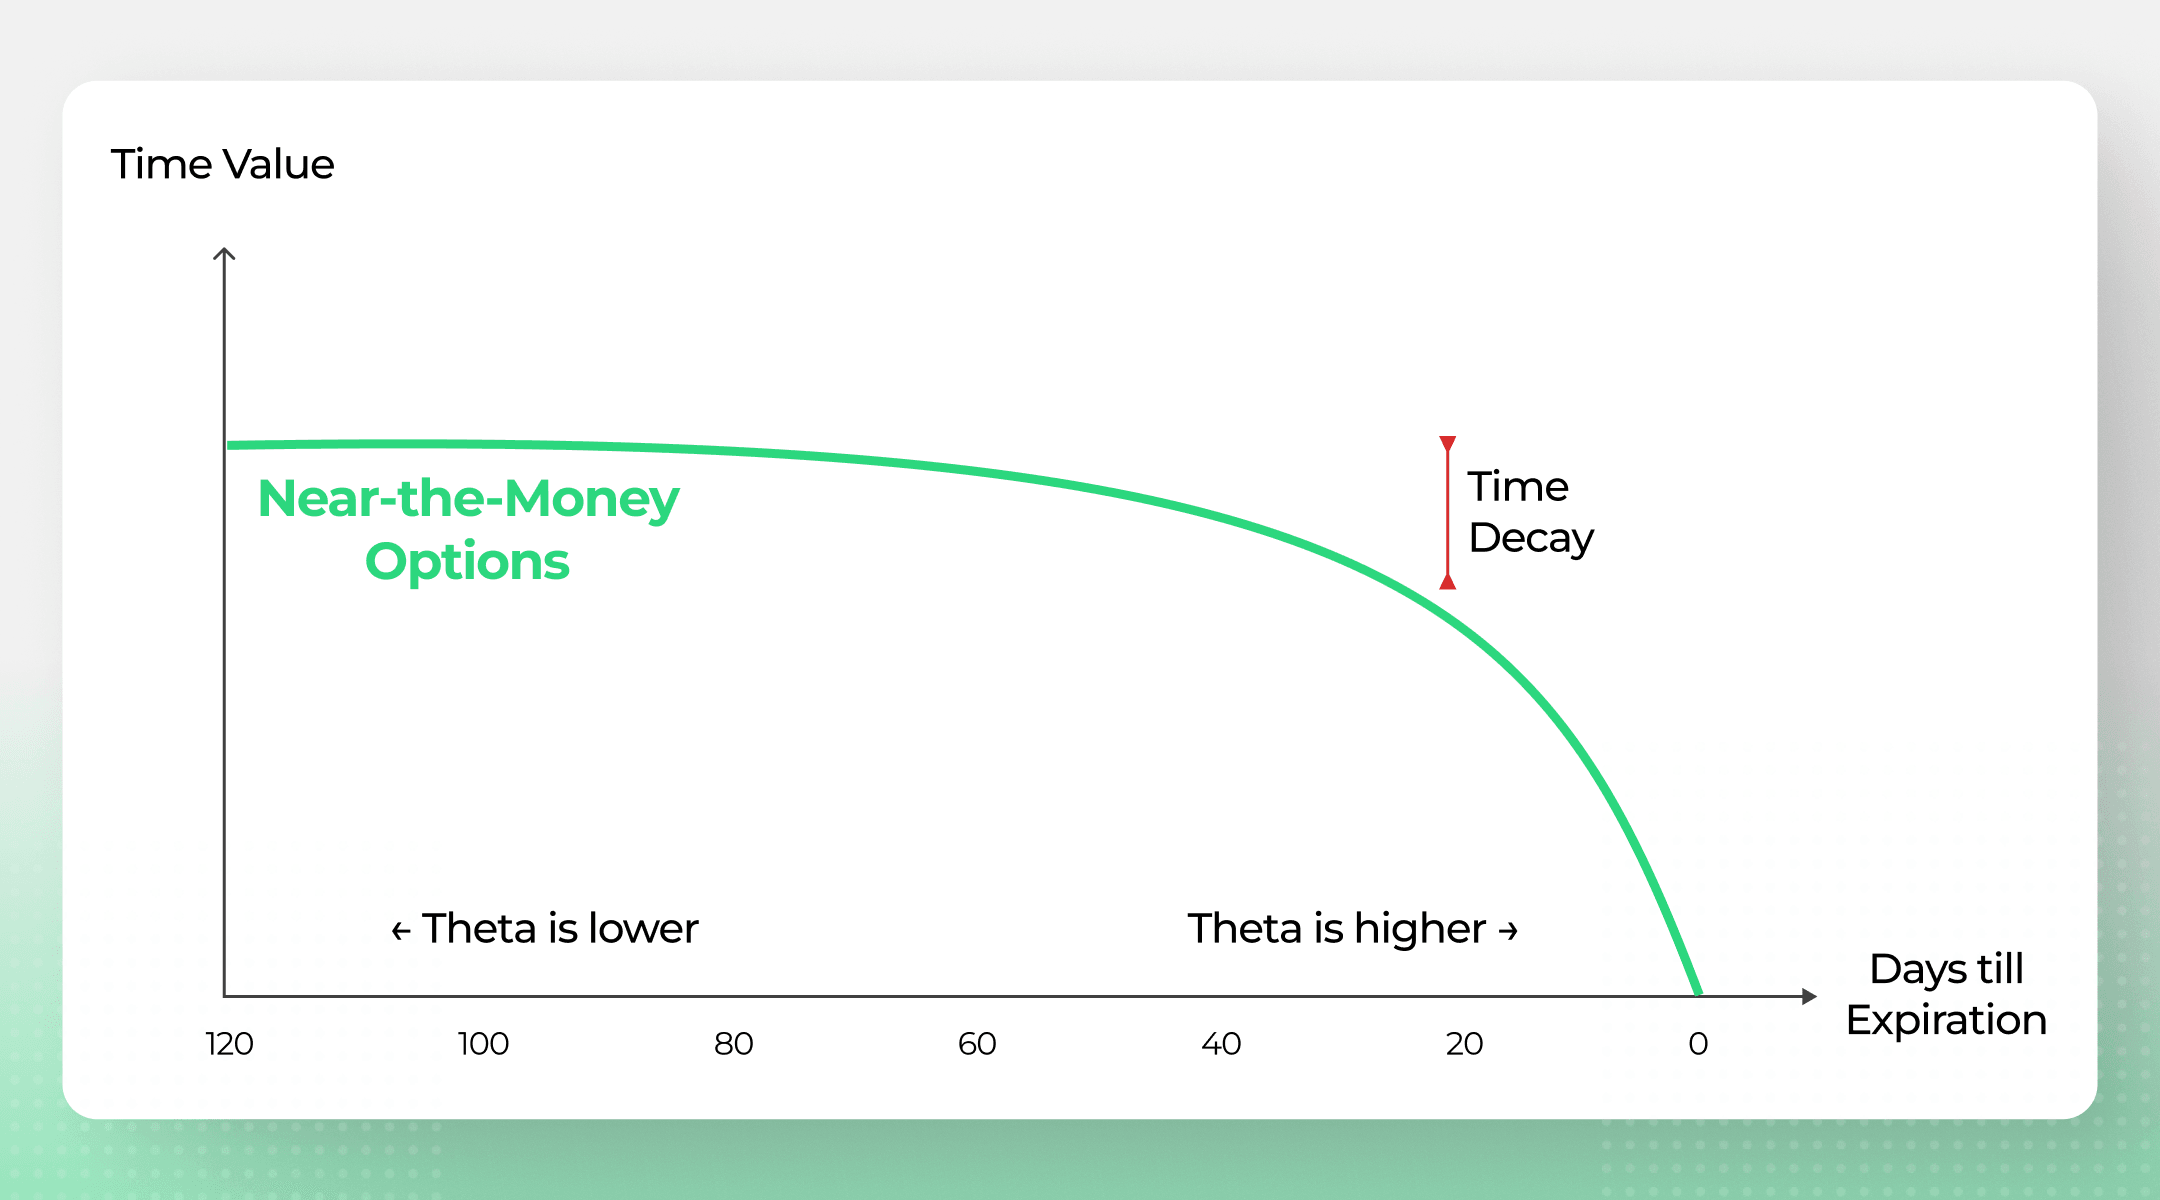
Learn what theta means in options trading, how time decay works for buyers and sellers, and how to use theta to measure portfolio risk.

5 min read
Comparing options trading vs day trading is like asking the difference between sugar and a cake: one can be part of the other, but not always. Is options trading day trading? Not always.

9 min read
Confused by strike prices? We break down in the money vs out of the money options using simple logic and real-world examples.

12 min read
Learn how the bull call spread, a classic debit spread strategy, can help you invest with a bullish sentiment.

10 min read
See what ADX sideways, bullish and bearish readings actually did on a stock over the next two weeks, and how to spot a false edge. Free backtest file inside.

Many traders focus on charts or news, but options positioning tells a different story. We’ve backtested our open interest report to see if it can help predict stock price moves.

10 min read
Following the results we showed in the first part of our series on Bollinger bands, let us show you through real-life examples how you can use this indicator to set up profitable trades. We have...

Most traders accept that every butterfly and iron condor must have a loss zone. You pay to enter. You hope price lands inside the sweet spot. If it does not you give it all back. That red block at the bottom of the profit and loss graph feels like the price of admission. It is not. In this video I break down how to use put call parity to build a butterfly and an iron condor where the entire curve at expiration sits at zero or above. You will see the exact leg swap that lifts the floor, how to verify the zero loss math before you trade, and how to find both setups live inside Option Samurai on real tickers like NVDA NFLX and BAC. You will also see why the butterfly gives you a tall narrow spike while the iron condor gives you a wide flat plateau, and why holding either to expiration is the wrong plan. In this video you will learn 1 Why the classic butterfly always has a loss zone and which leg to swap to erase it 2 How the riskless iron condor is built and why it costs more capital 3 How to scan for both setups live inside Option Samurai 4 Spike versus plateau where each structure wins 5 Why to close early and recycle capital instead of riding to expiration ⸻ About Option Samurai Option Samurai helps you find better trades faster. Our scanner and Excel plus Google Sheets integrations are built for serious options traders who want clarity speed and an edge. The scans shown in this video are live inside the platform with full profit and loss visualization so you can see risk before you commit capital. ⸻ 🚀 GET STARTED 🌐 Try it free: https://optionsamurai.com 📖 Learn put call parity from the ground up: https://optionsamurai.com/blog/put-call-parity-formula/ ⸻ 👍 Like this video if it helped you 🔔 Subscribe for more options trading strategies and tools 💬 Drop a comment if you have questions or ideas for future videos ⸻ Chapters 00:23 - Ground rules what riskless really means 01:46 - The riskless butterfly and the leg swap 03:38 - How to find riskless butterflies on Option Samurai 04:31 - The riskless iron condor 05:47 - How to find riskless iron condors on Option Samurai 06:30 - Spike versus plateau: butterfly or iron condor? 07:16 - Close early then recycle

Most traders stare at one option chain at a time. They open one expiration then another then another. They compare premiums strike by strike and guess which put offers the best annualized return for the cushion they keep. It is messy. It is slow. And the best trade stays hidden in the noise.But what if every strike and every expiration was ranked side by side in one clear viewIn this video I walk you through Option Samurai Sell Put Optimizer, the Google Sheets template that scores every put for you instantly. You will see exactly how toSet any ticker and let the sheet import live option dataCompare annualized return across all strikes and expirations in a single matrixSpot the sweet spot where yield meets break even cushionFilter by earnings dates so you can avoid or target earnings riskTune your assumptions and watch the whole table recalc in secondsInstead of flipping between tabs you pick the winner in one view. ⸻ About Option Samurai: Option Samurai helps you find better trades faster. Our scanner and Excel plus Google Sheets integrations are built for serious options traders who want clarity speed and an edge. The Sell Put Optimizer shown in this video ranks every put by annualized return so you can choose with data not guesswork. Set your criteria once. The sheet finds your next best contract. ⸻ 🚀 GET STARTED 🌐 Try it free: www.optionsamurai.com (no CC needed) 📖 Install the add in: https://samurai.froged.help/docs/en/43597154-research 📋 Use this template: https://docs.google.com/spreadsheets/d/1UBHlWzUlgEPxyv_ia5LYmT-fIOnXCMF3YvwaxhsnfJs/edit?usp=sharing 🔧 Browse more templates: https://optionsamurai.com/app/integrations/excel 👍 Like this video if it helped you 🔔 Subscribe for more options trading tips and tools 💬 Drop a comment if you have questions or ideas for future videos ⸻ Chapters: 00:18 - The manual chain problem this template solves 01:01 - Table one annualized return explained 01:30 - Table two how far price can fall 02:58 - Customize with your own valuation

In this video, I break down the 2 to 3 Ratio Spread strategy, the systematic upgrade to the classic 1 to 2 that leaves most traders with unmanageable risk. While most traders sell a 1 to 2 and hope price pins perfectly, the 2 to 3 creates a wider profit tent, a smoother delta profile, and a clear path to manage the trade when price moves against you. You will see the exact profit and loss shape for both the put ratio spread and call ratio spread, where breakeven sits, why implied volatility can make or break the entry, and how a simple butterfly roll lets you transform a threatened ratio spread into a defined risk position without guessing. No gambling. No predictions. Just probabilities and process. ⸻ About Option Samurai Option Samurai helps you find better trades faster. Our powerful scanner and tools are built for serious options traders who want clarity, speed, and an edge. The ratio spread scans shown in this video are live inside the platform, with filters for put ratio and call ratio setups, plus profit and loss visualization so you can see risk before you commit capital. ⸻ 🌐 Try it free: https://optionsamurai.com 📖 Put Ratio Spread guide: https://optionsamurai.com/blog/put-ratio-spread/ 📖 Call Ratio Spread guide: https://optionsamurai.com/blog/call-ratio-spread/ 📖 Feature guide: https://samurai.froged.help/docs/en/43597154-research ⸻ 👍 Like this video if it helped you 🔔 Subscribe for more options trading strategies and tools 💬 Drop a comment if you have questions or ideas for future videos ⸻ Chapters 0:00 Why Most Ratio Spreads Fail With 1 to 2 0:42 What Is a Ratio Spread 1:28 Put Ratio Spread vs Call Ratio Spread Explained 2:25 Why the 2 to 3 Ratio Changes the Math 3:18 The Butterfly Roll How to Manage a Threatened Spread 4:27 How Implied Volatility Impacts the Trade 5:14 Scanning for 2 to 3 Ratio Spreads in Option Samurai 6:02 Key Takeaways and Next Steps