Collar Payoff Calculator Template - Visualize P&L, Fees, and Dividend Impact
Published on September 18, 2025Reviewed by Leav Graves
This article is a hands-on guide to our collar calculator, built to help you examine, visualize, and log collar trades. While our template will work for every collar trade, we believe the best focus of this tool is to help you assess risk-free or low-cost trades by factoring dividends, fees, and realistic fills. You’ll learn inputs, charts, and a quick workflow to spot and execute viable collars with confidence.
KEY TAKEAWAYS
- Our options collar calculator lets you model capped downside risk, choose legs, and see payoff, fees, dividends, best and worst outcomes.
- This collar calculator solves a common problem: calculating exact best and worst case returns while including dividends, making it easy to spot risk free or zero cost collar opportunities.
What is the collar options strategy?
The collar is a 3-leg position on 100 shares plus 2 options - one long put and one short call - creating a payoff band. Strikes and expiration set the floor and the cap. To better understand how our template works, you should keep in mind that there are 2 versions of this strategy, as we show below.
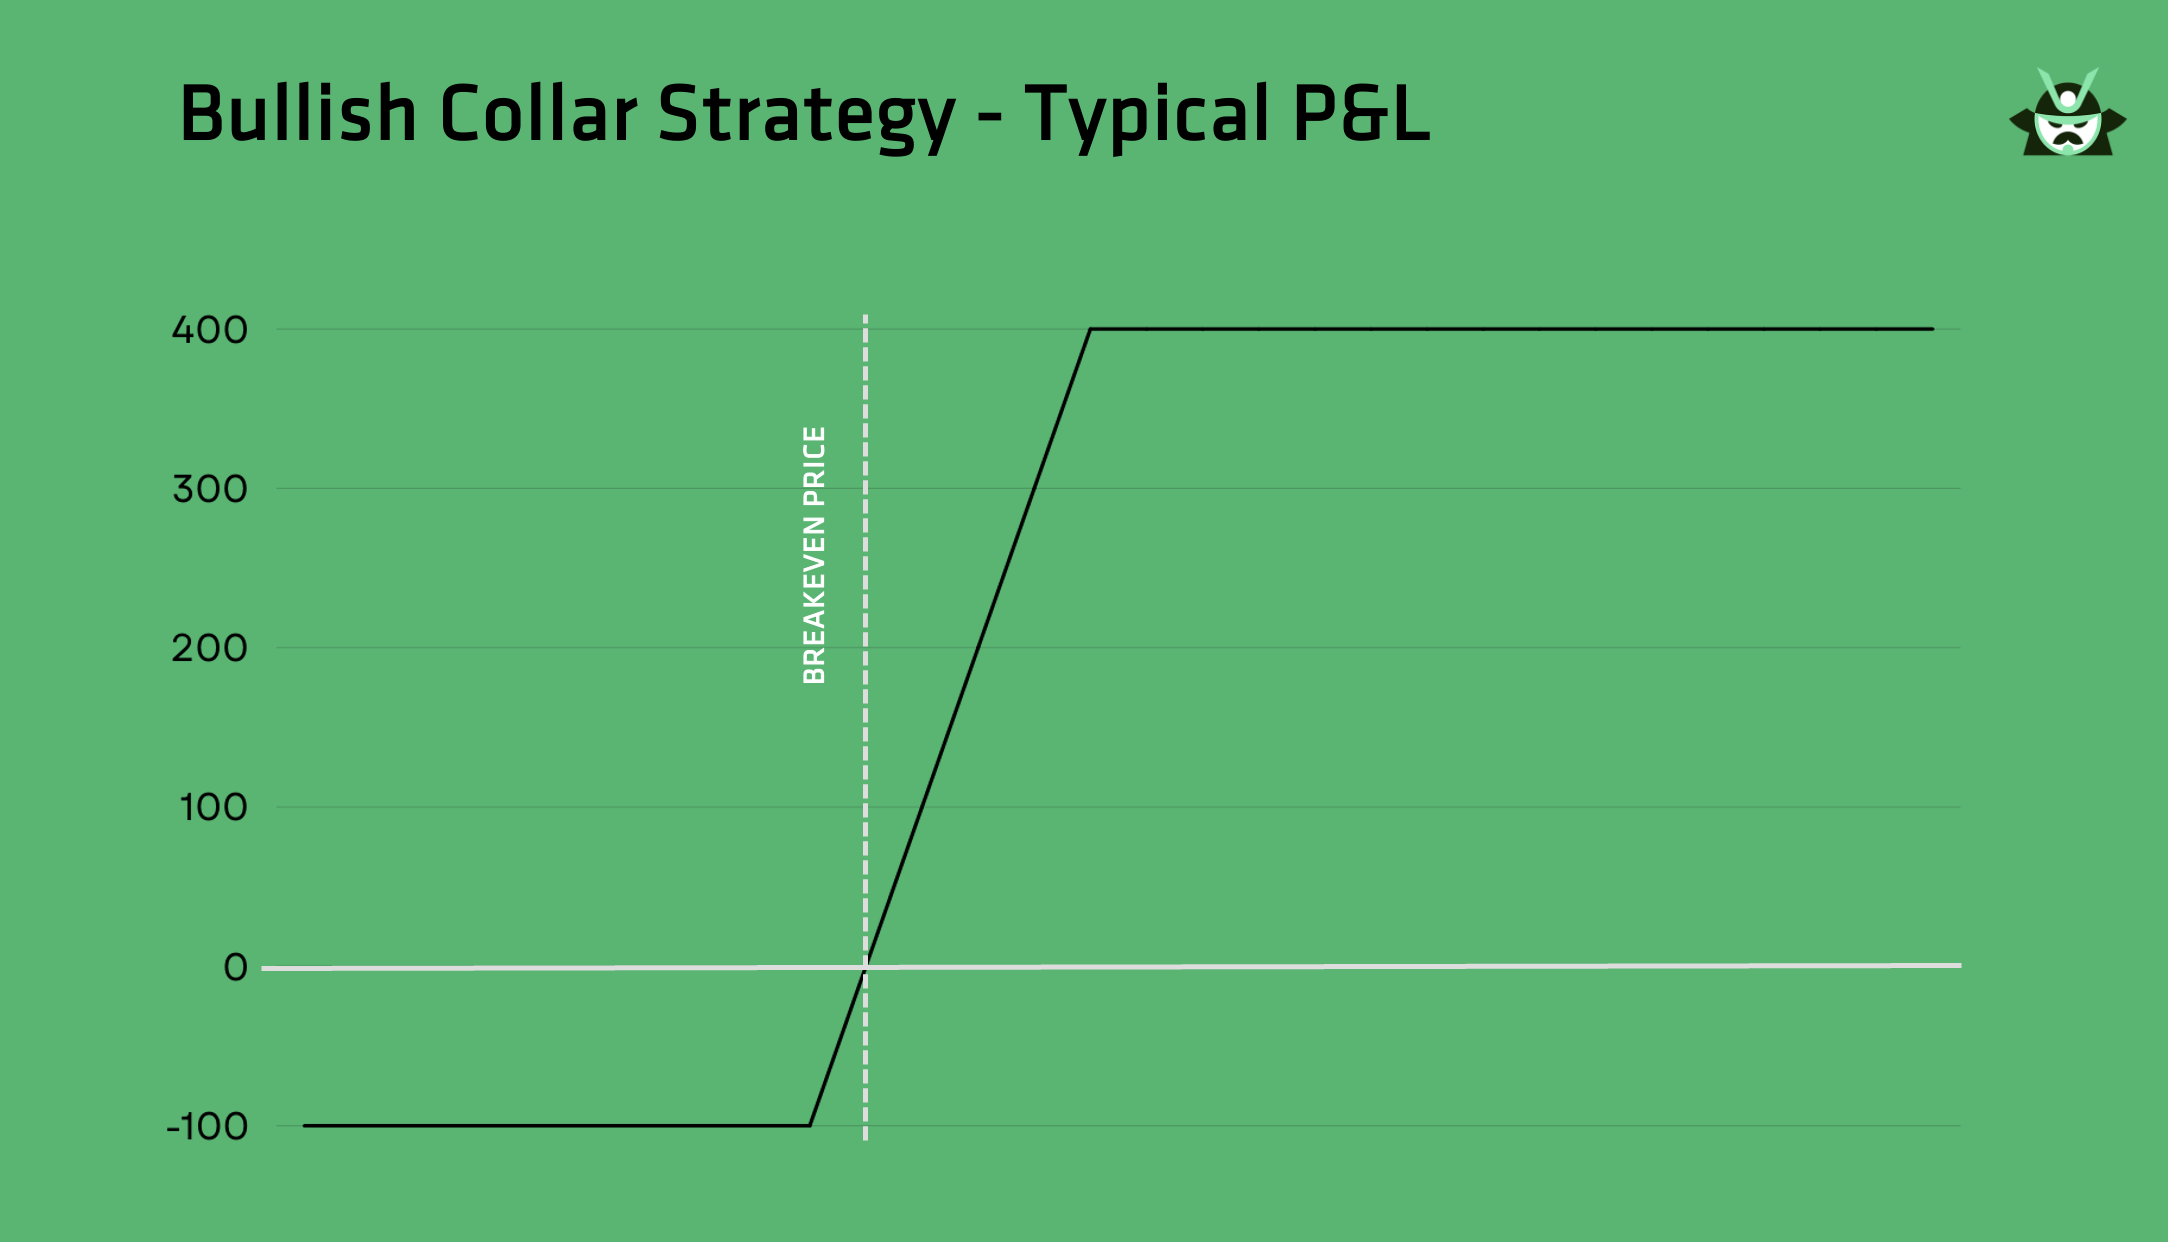
Bullish collar
Buy 100 shares, buy a put (floor), sell a higher call (cap). Your goal here is to cap downside and fund protection with the short call for a neutral to mildly bullish view. The intent here is clear when you take a look at the P&L chart of the strategy:
Bearish collar
Buy 100 shares, sell a call, buy a higher put to tilt more defensive risk - tighter cap and stronger floor. This is exactly the opposite as the previous strategy, as you can see from the P&L below:
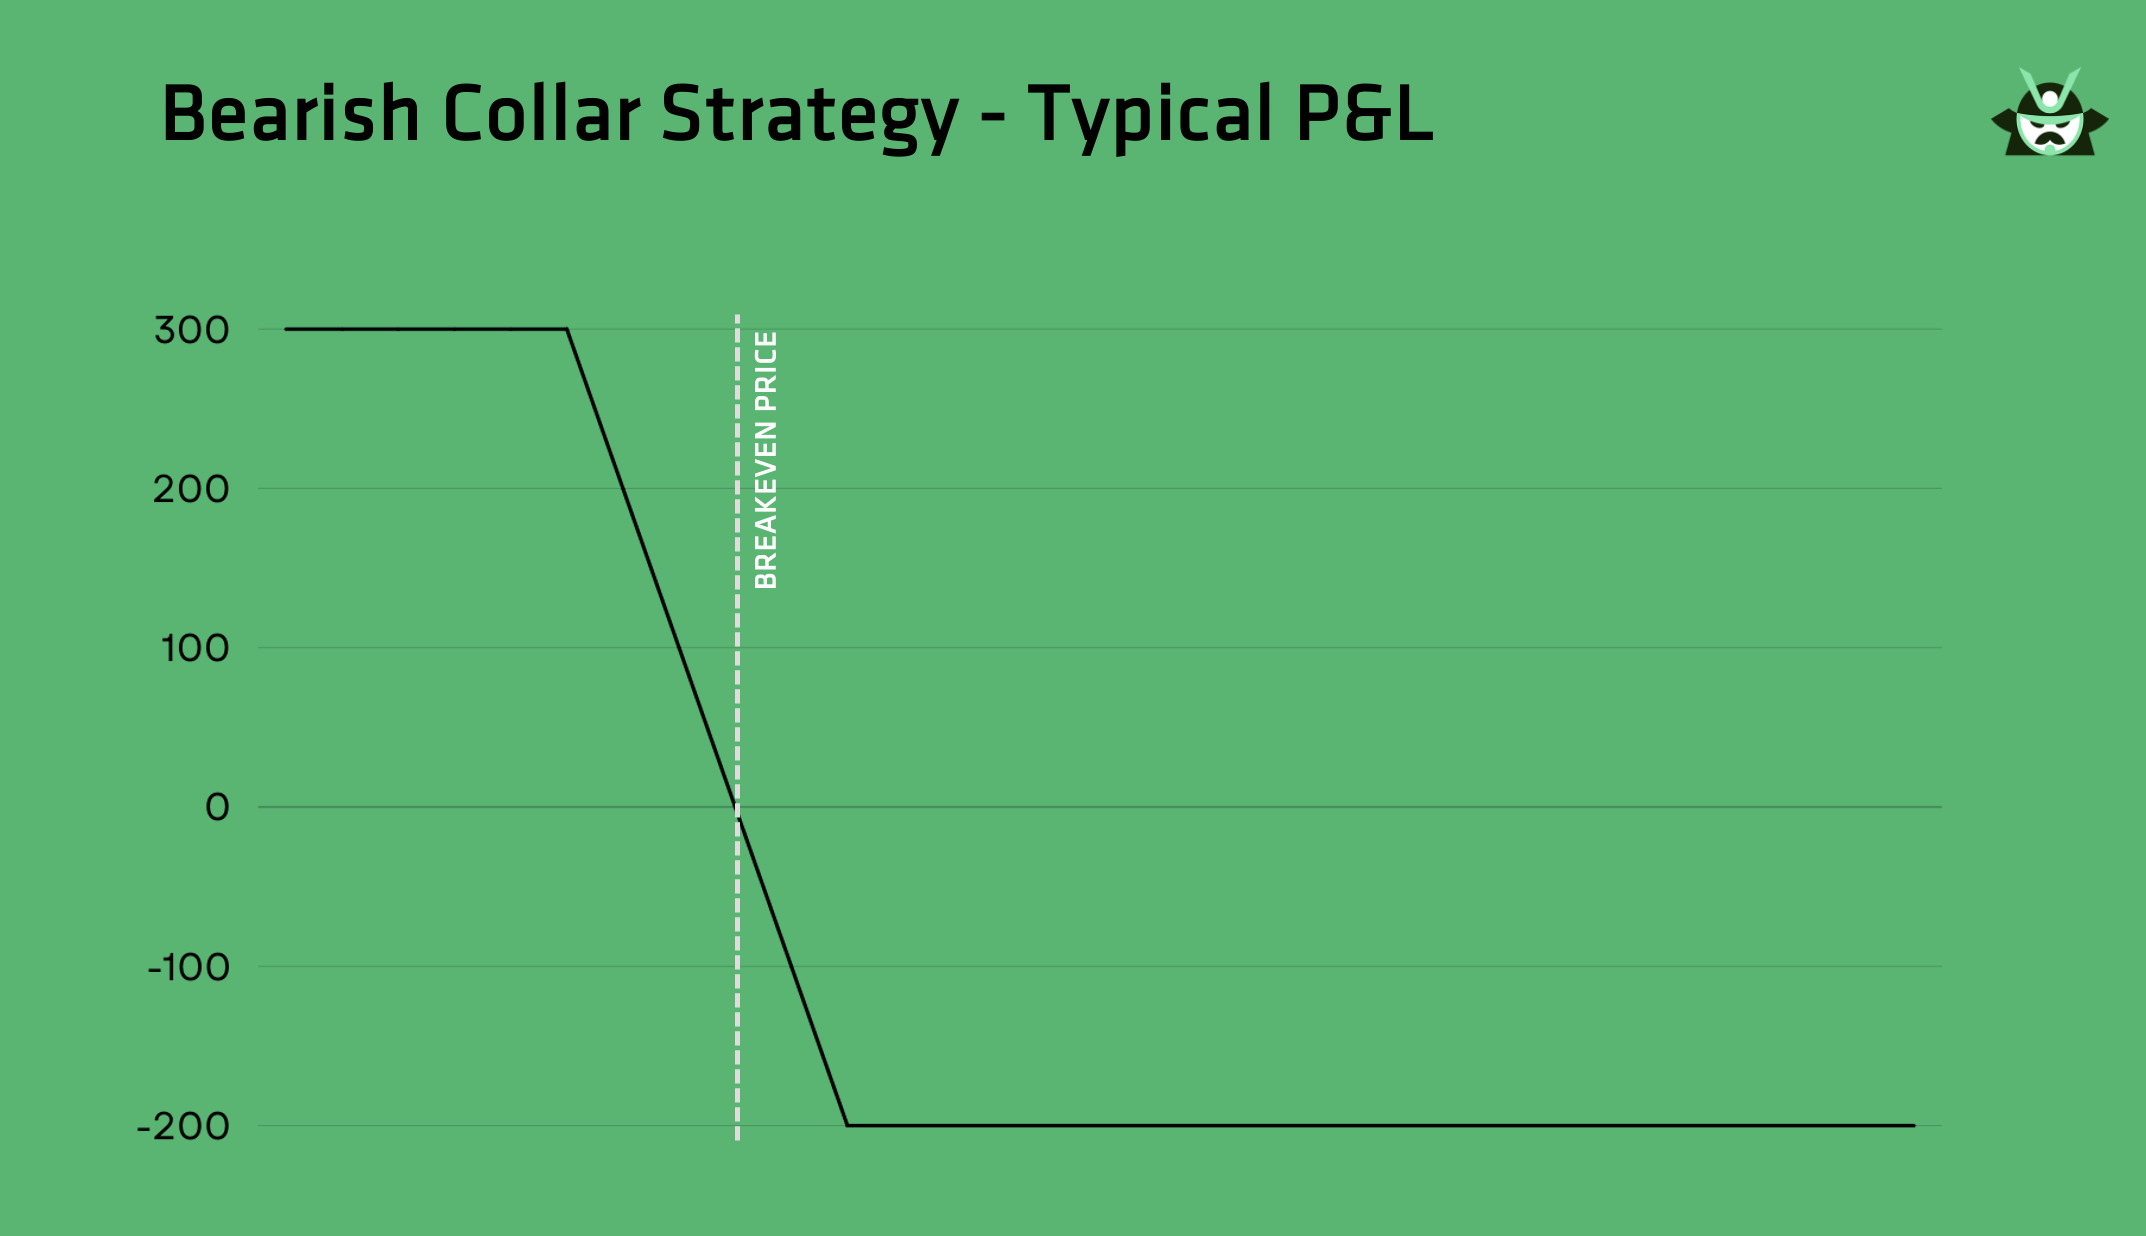
Keep in mind the shapes of these two P&Ls, since they will help you choose which strategy makes more sense in a given scenario.
Risk-free collars in practice
Put–call parity keeps prices in line: call price minus put price roughly equals the stock price minus the present value of the strike, adjusted for interest rates and expected dividends. For a collar, this relationship explains why the net package can be zero cost or even a small credit.
There are two versions to aim for:
- Dividend-assisted no-loss: add the expected dividend to your P&L. If the worst case after fees is ≥ 0 due to the dividend, the collar is effectively risk free.
- Pure no-dividend: a collar can be no-loss even without dividends when the short call premium plus the risk free carry on the 100-share notional covers the put cost and fees. It’s not rare - the driver is the risk free rate. If 100 * share price * risk free rate (pro rated to your term) exceeds the net premium gap, worst case is at least 0 and often a small credit. This happens a lot in SPY and QQQ because the notional is large.
Both of these versions are easy to spot with our template. In other words, if your worst-case scenario P&L is still profitable, you’re looking at a risk-free collar (we will soon show you an example of a trade like this one).
How the collar calculator helps you find zero or low cost collars
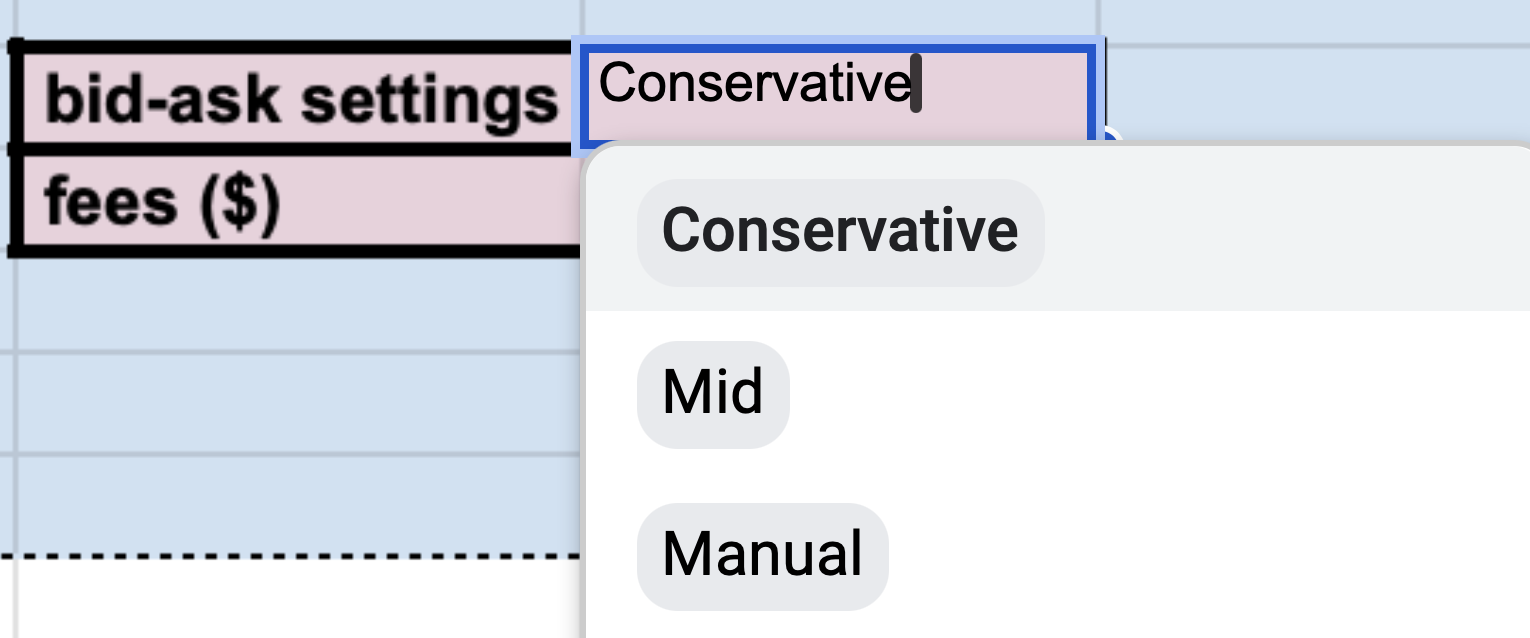
Start with pricing. The calculator has three bid ask settings: Mid uses mid prices for each option, Conservative uses bid and ask like some brokers do, which makes fills more realistic, Manual lets you enter one total price for the whole collar - 1 stock leg plus 2 option legs - so you can test the exact package order your broker accepts. Use Conservative when you are exploring setups and comparing strikes or expirations. Switch to Manual when you want to place a specific trade and set the exact all in package price.
Next, enter the ticker and expiration, fetch the next expected dividend, override it if needed, and set your fees. Compare the displayed collar cost to the expected dividend. If the dividend covers the package cost and fees, you are near zero or a small credit. Then scan strikes to tighten or widen the band until the collar lands at zero cost or better.
Before you trade, confirm the edge in two places. The % Return chart shows best and worst outcomes and highlights the dividend slice of the return. The Total P&L table includes dividends through expiration, so you see the full payoff of the collar, not just the option legs.
Options collar calculator - A bullish risk-free example
As promised, here is a simple example on a bullish risk-free collar you can find on our template.
Step 1 - Set the basics
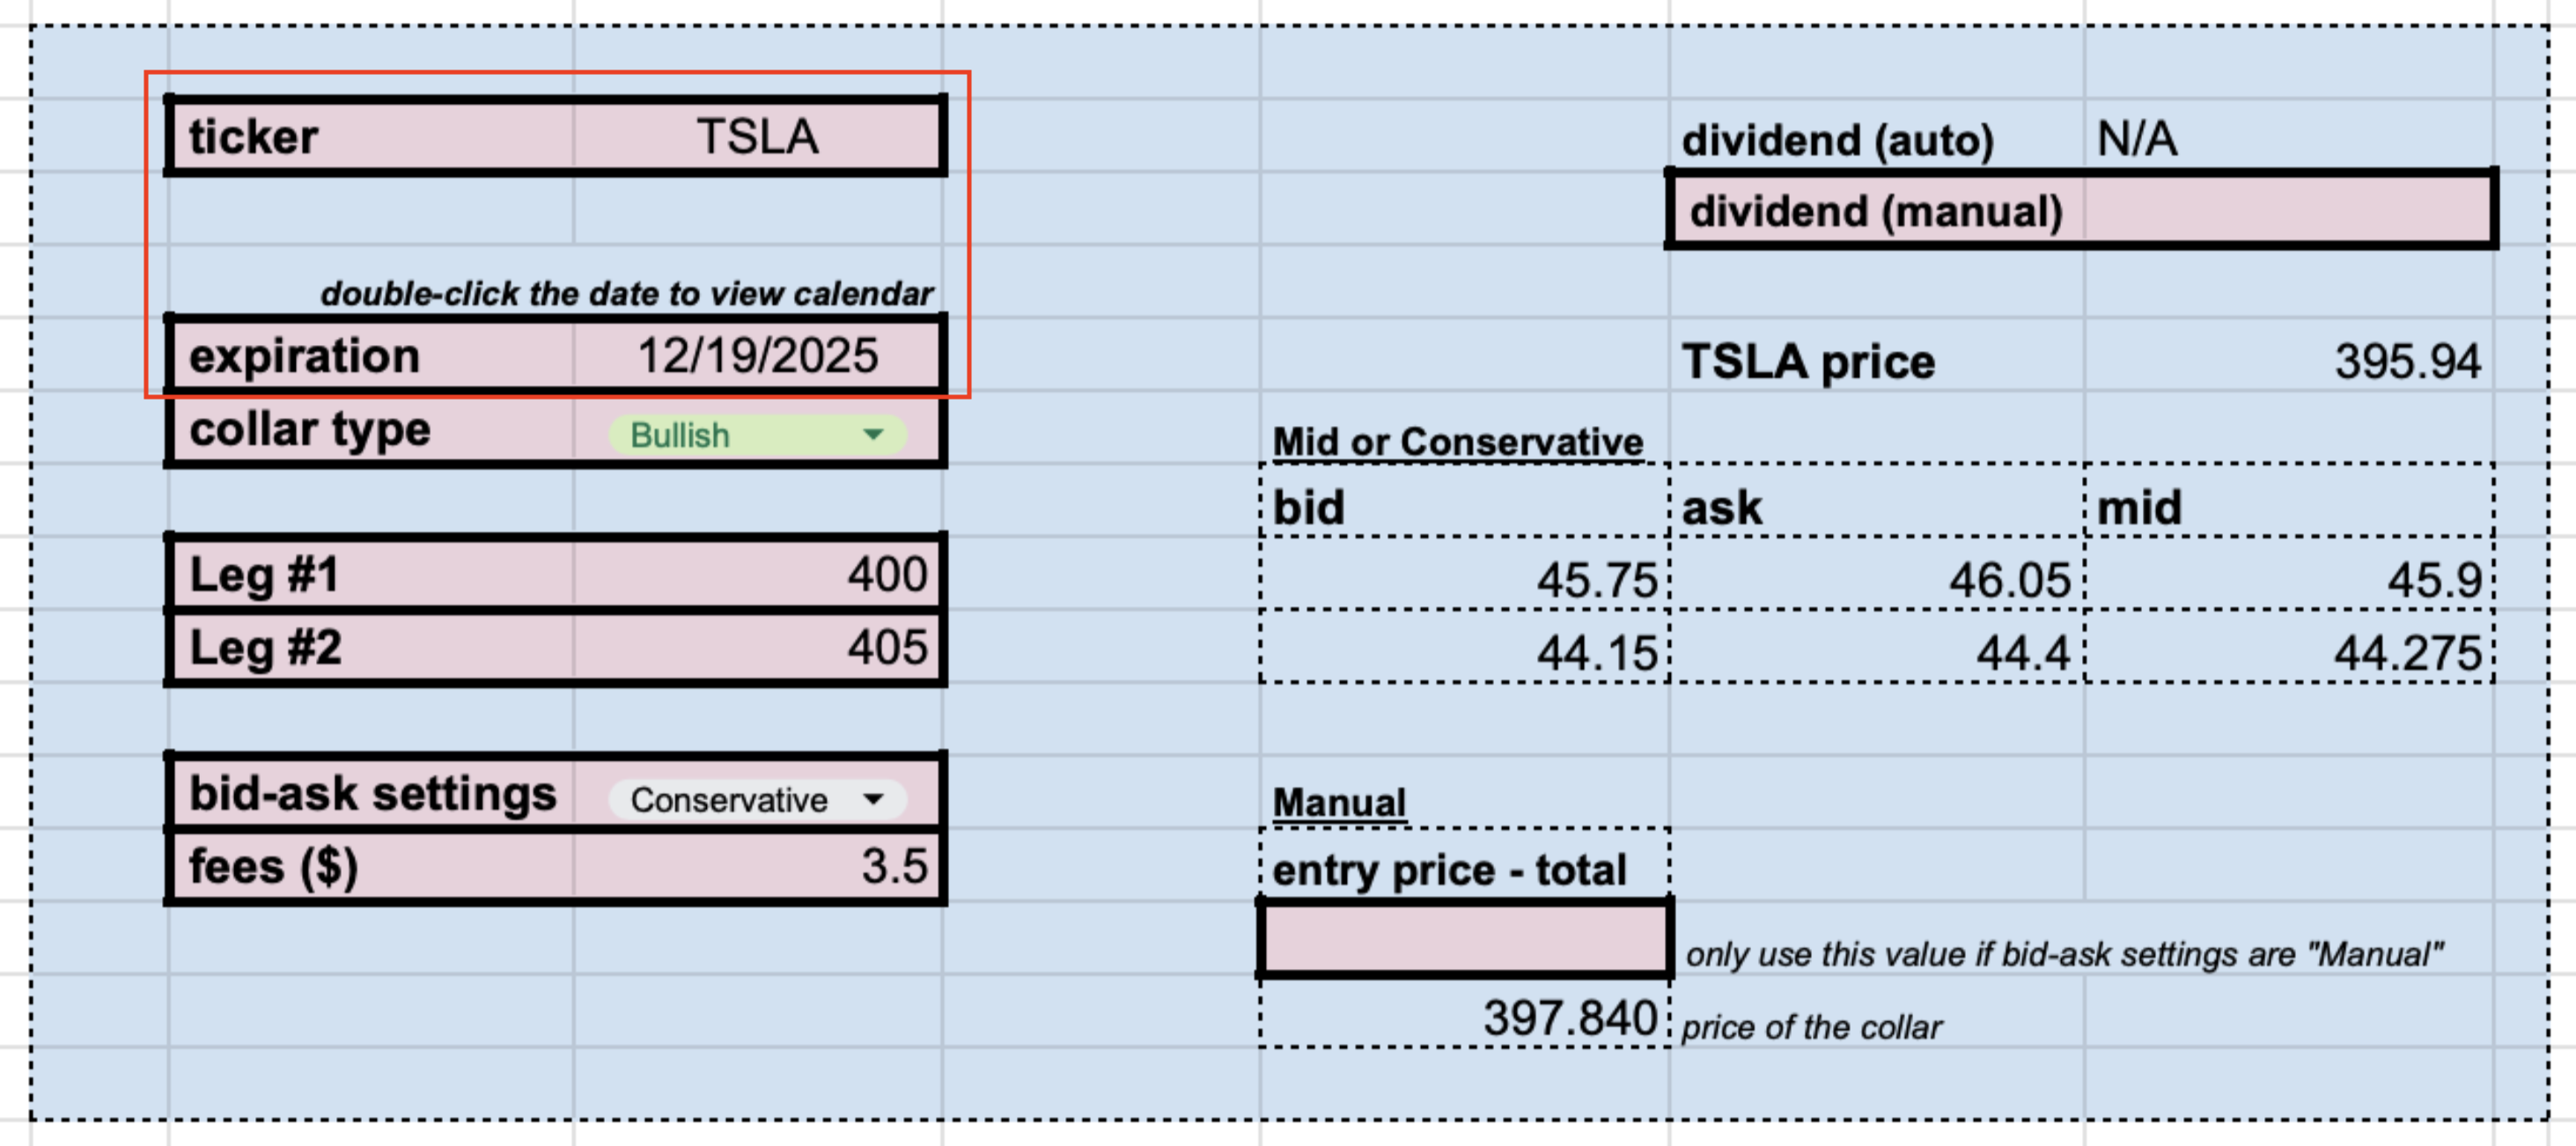
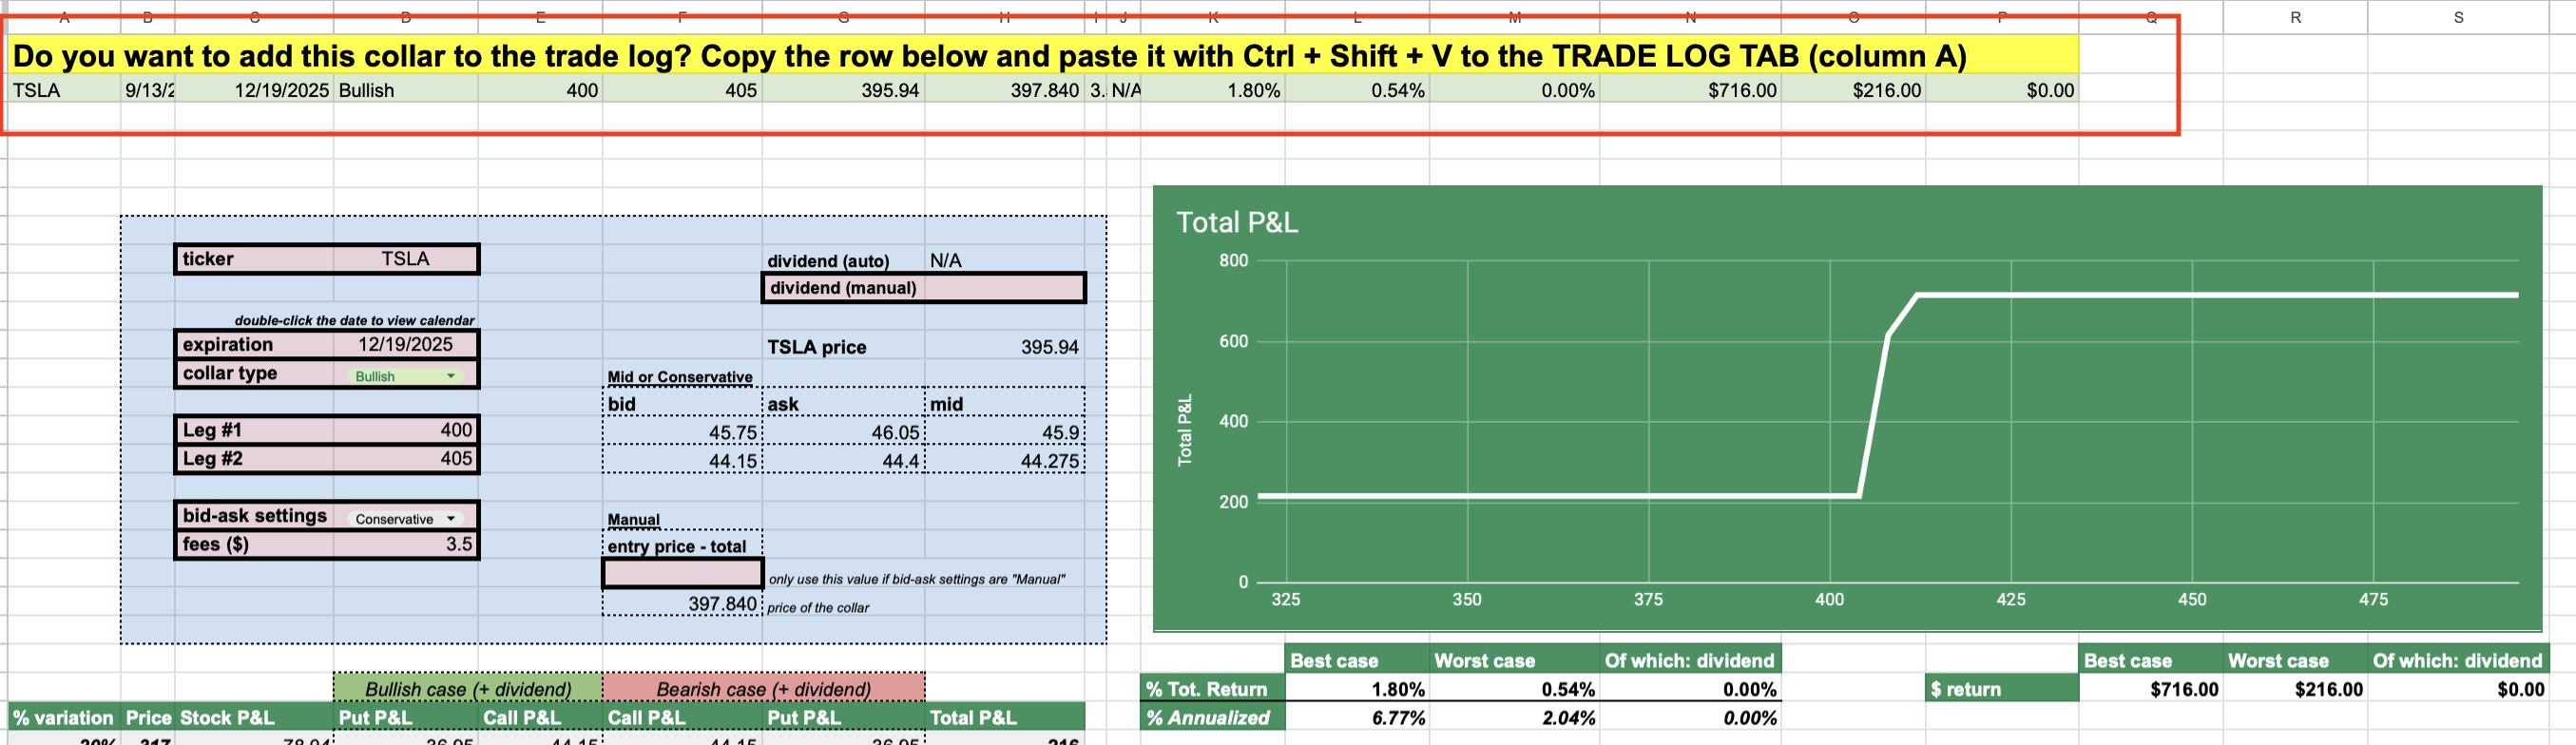
In the CALCULATOR tab, enter the TICKER in D8 and the EXPIRATION DATE in D11 using the calendar picker. Pick a date that fits your plan. For a concrete run, choose TSLA with an expiration 3 months from now.
Step 2 - Pick the collar type
In D12, select bullish. This tells the sheet which leg is protection and which leg caps upside so the math and charts line up with a bullish collar.
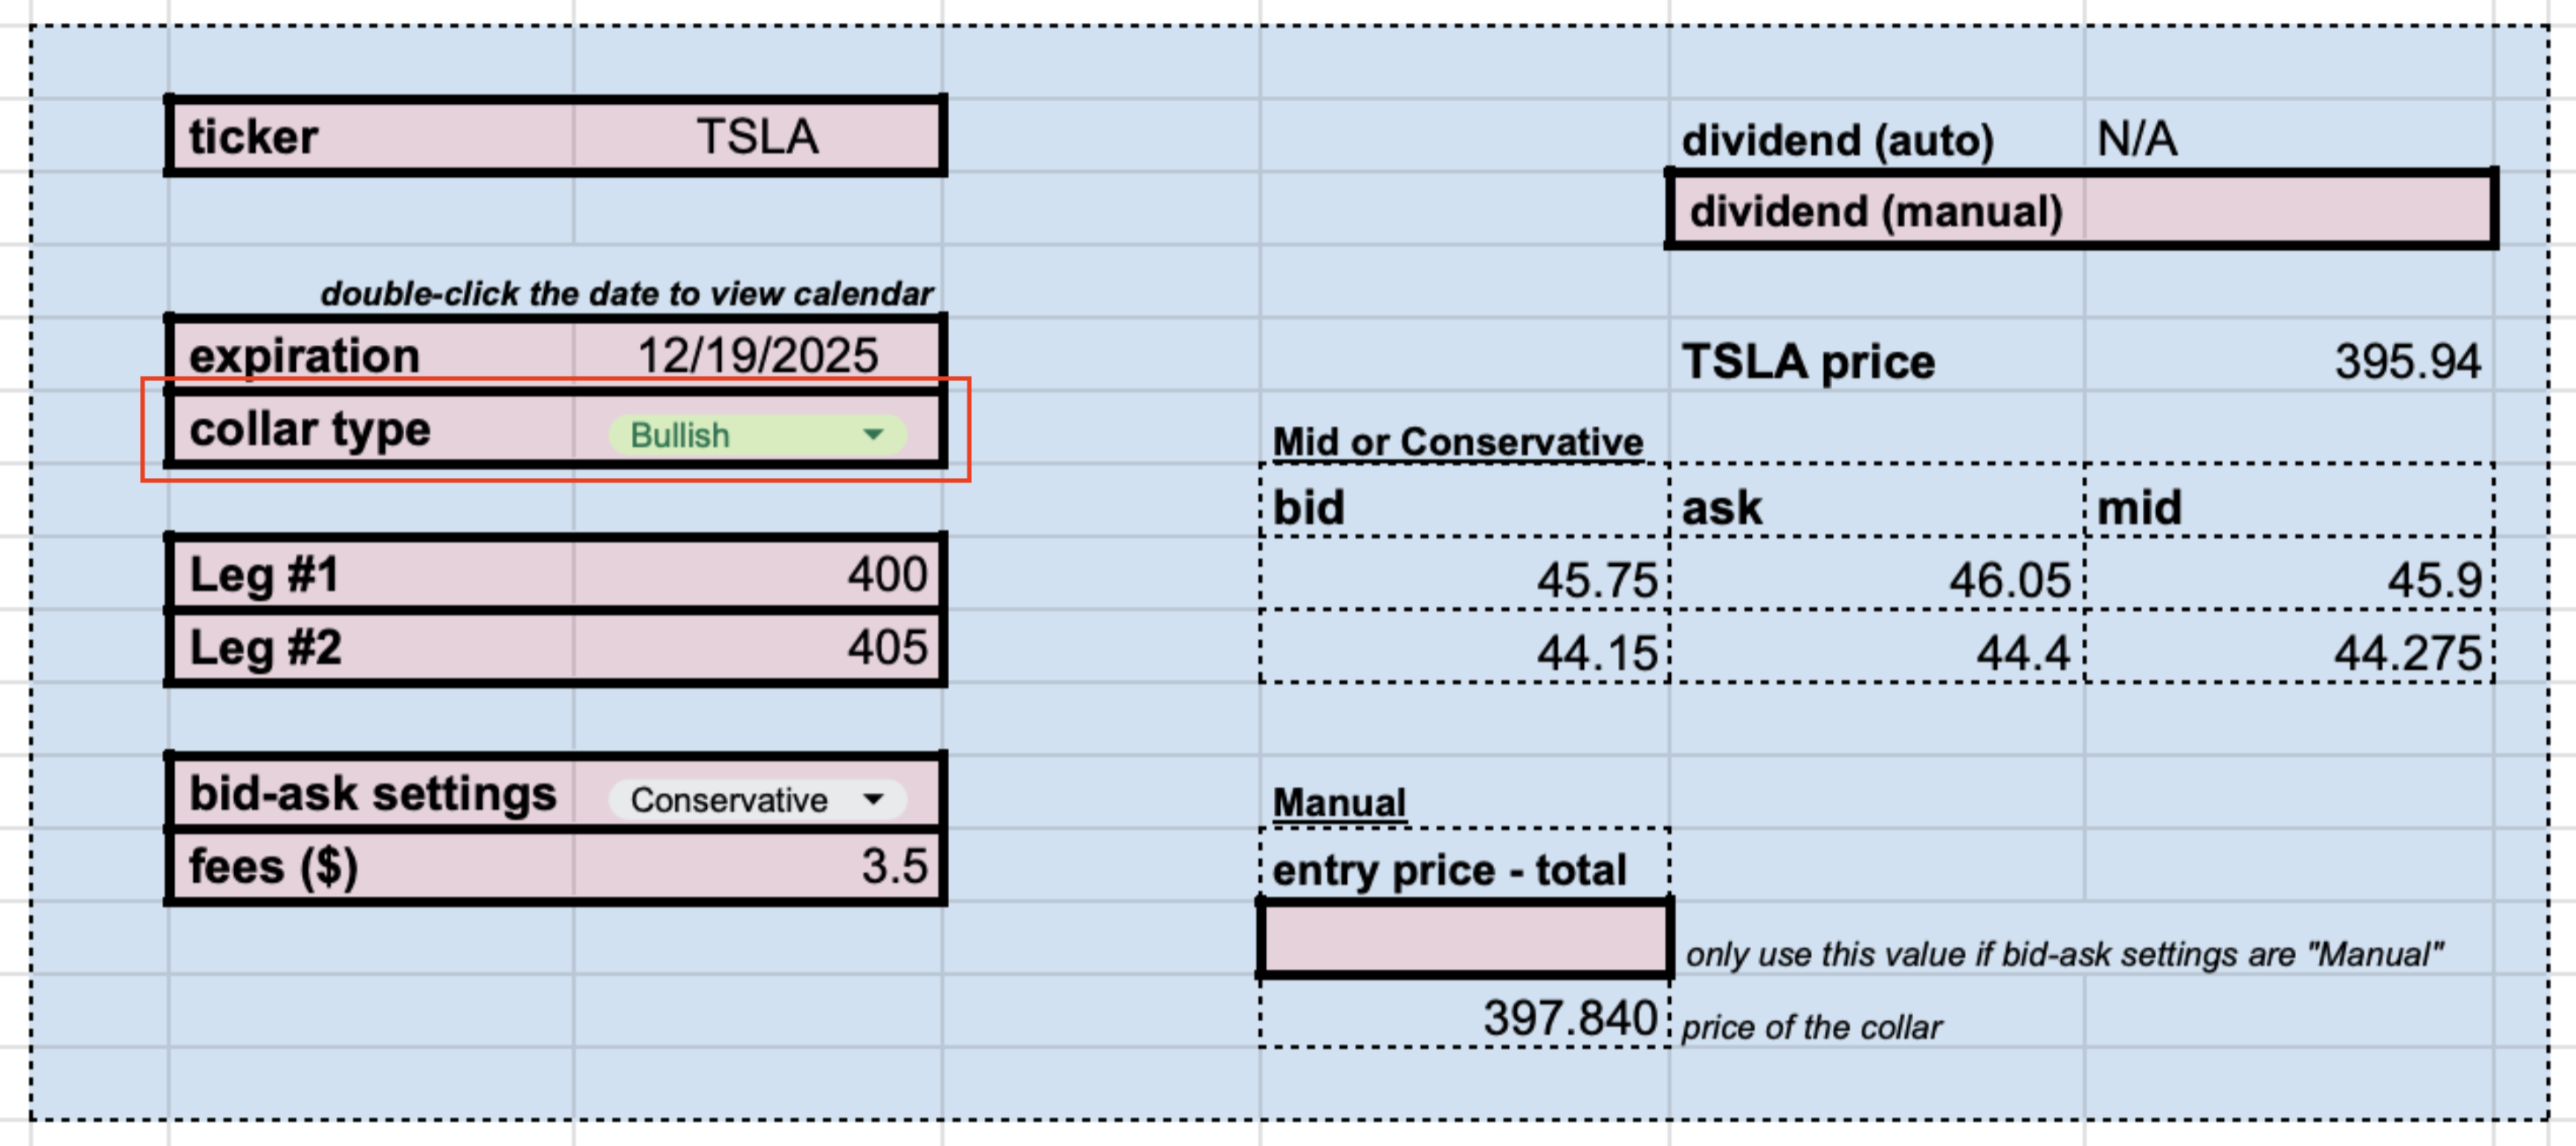
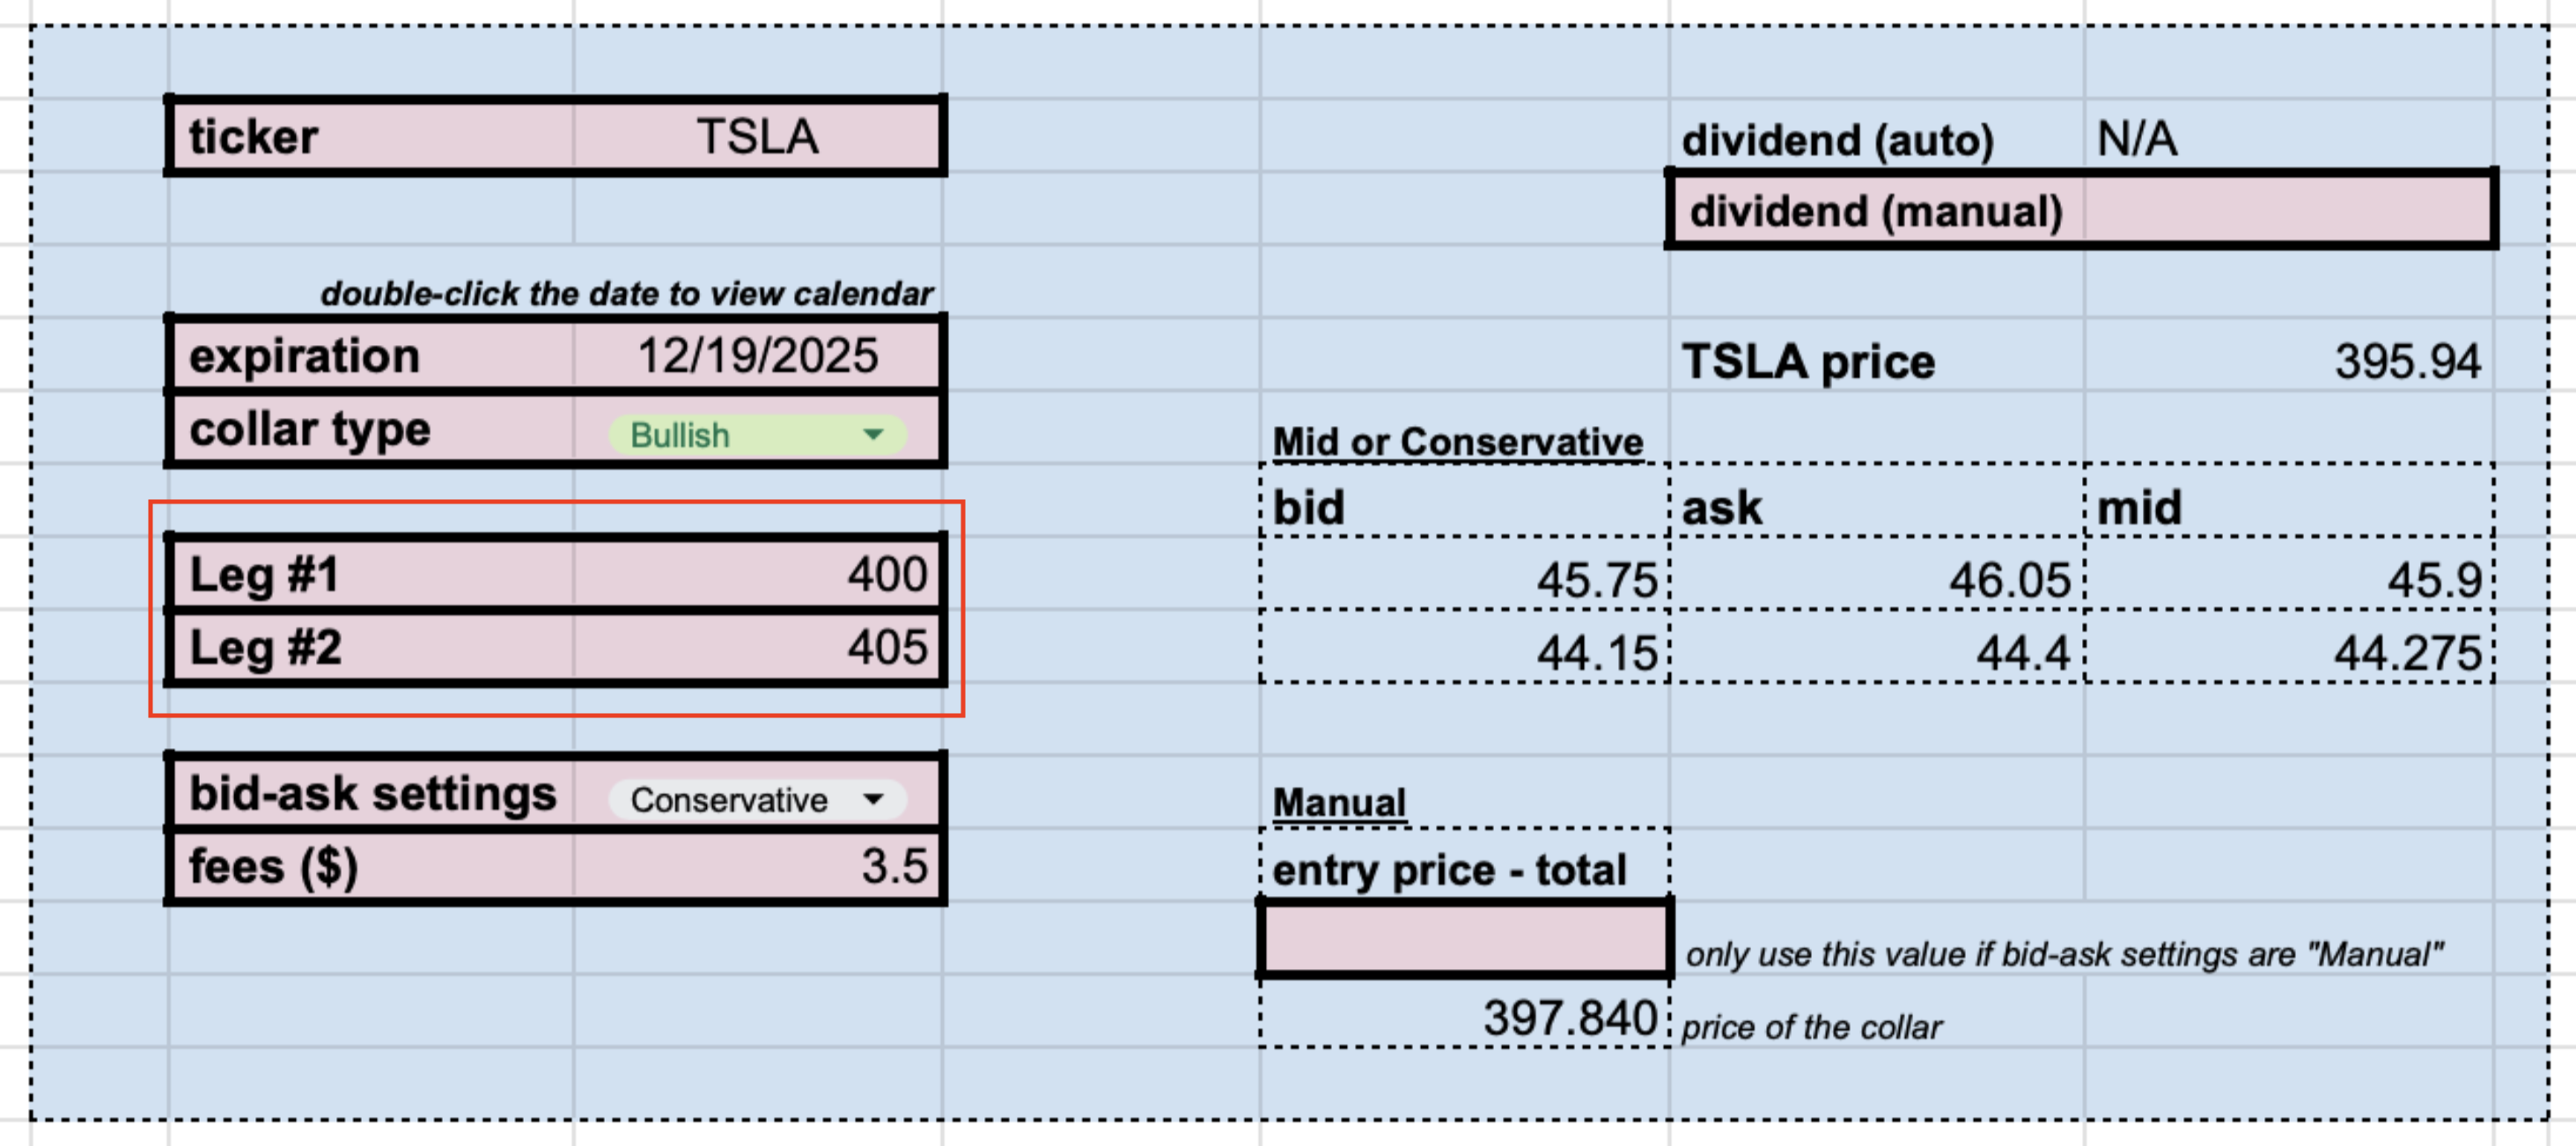
Step 3 - Choose your strikes
Type your two strike prices in D14 and D15. Order does not matter - the sheet maps call and put automatically for a bullish structure. With TSLA at 395.94, try 400 and 405 to see what kind of trade you will get.
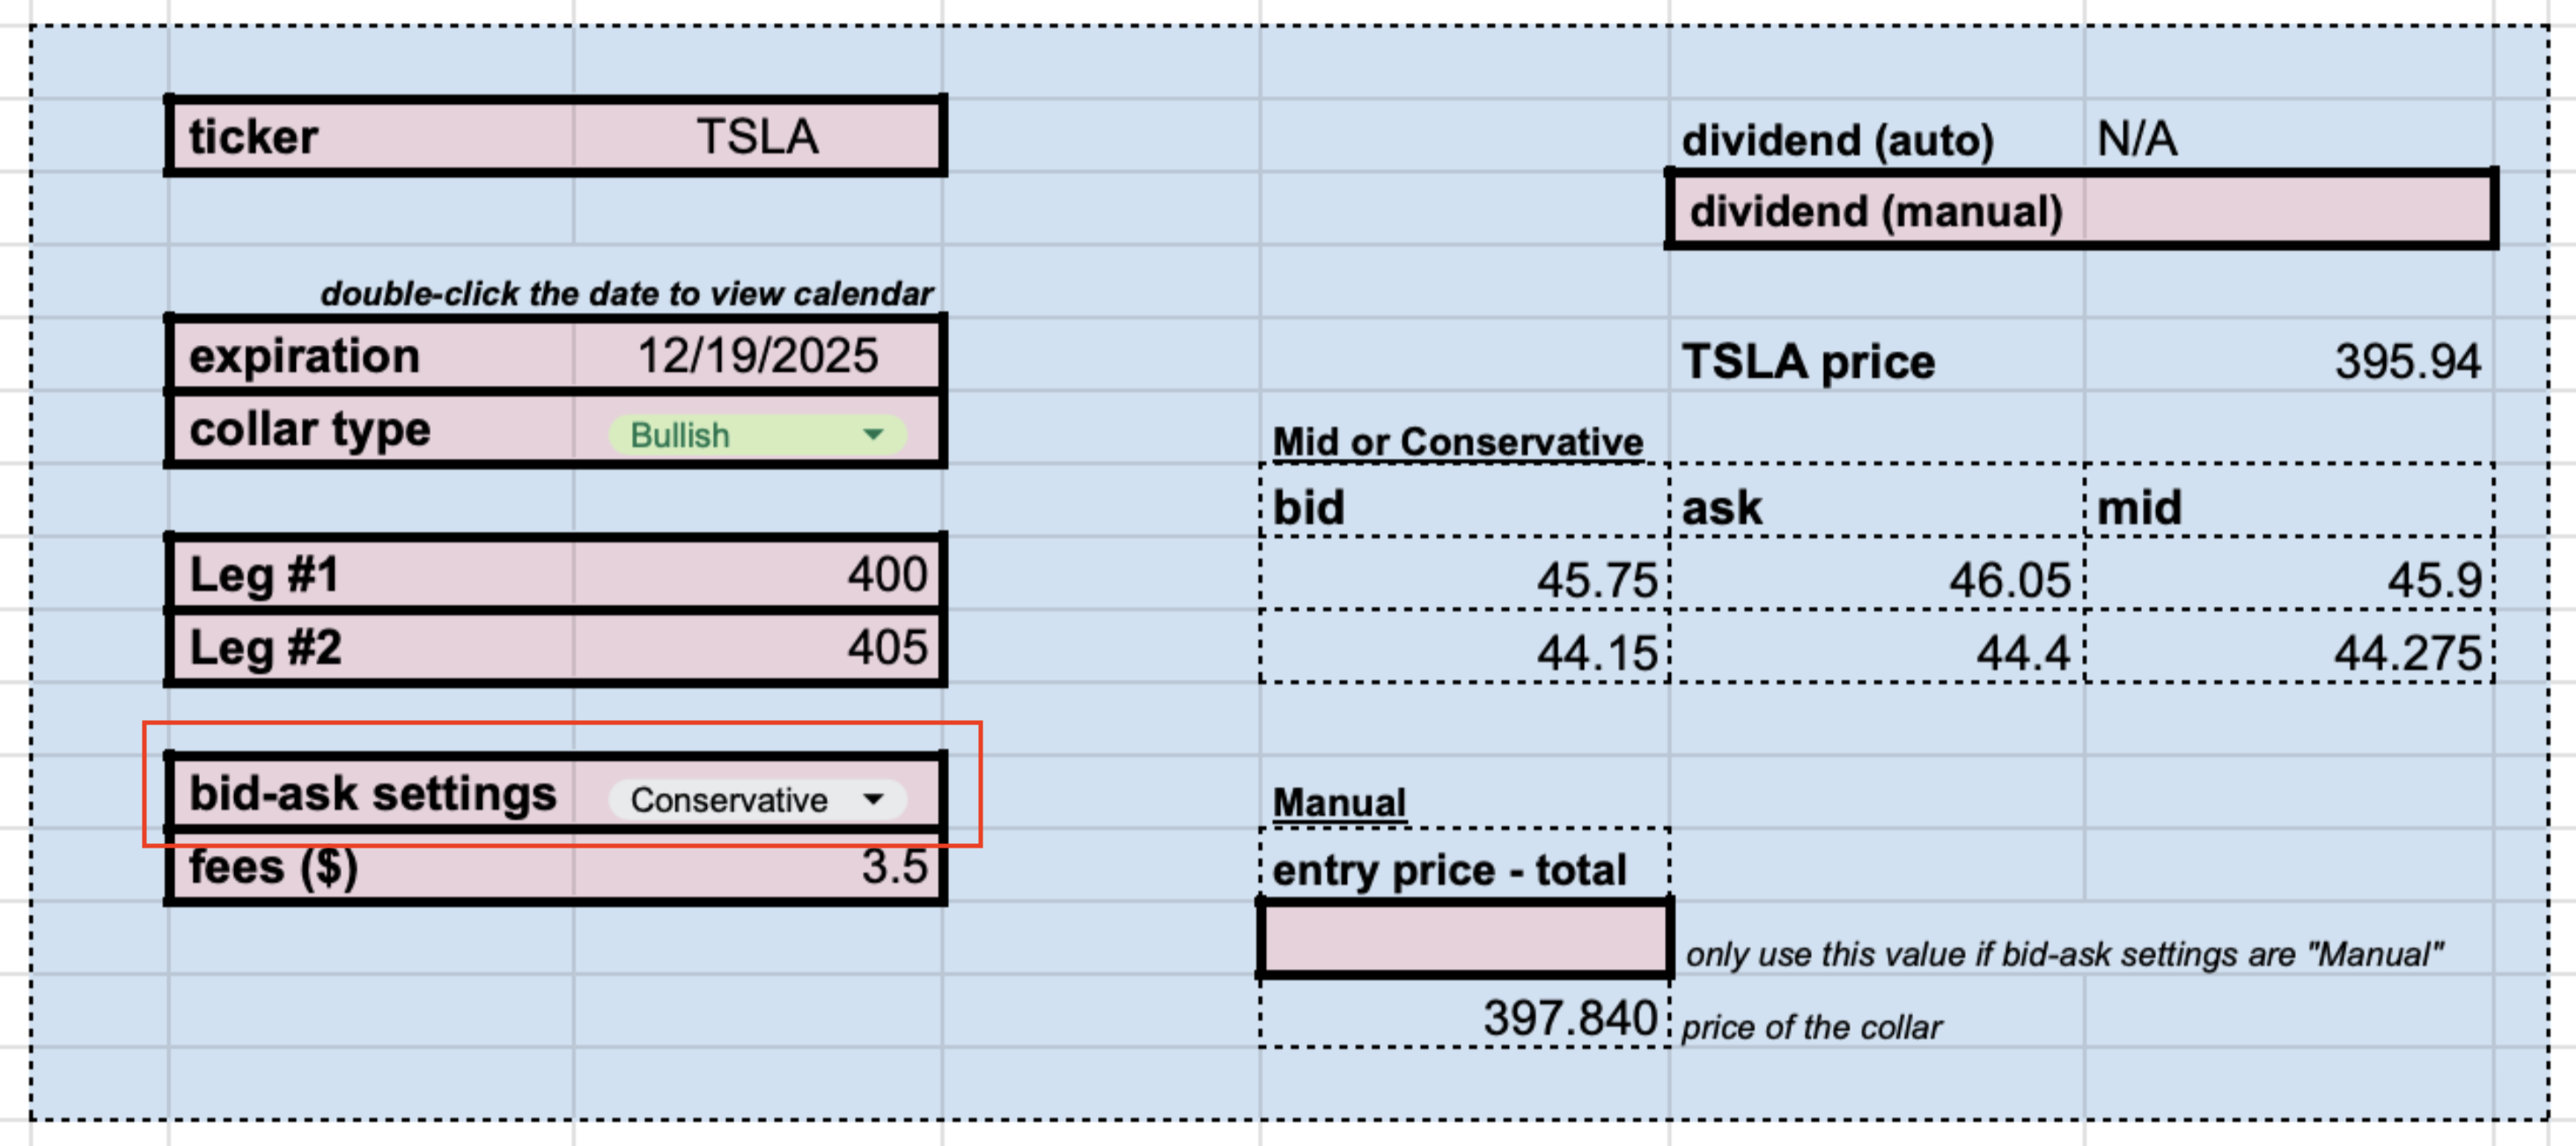
Step 4 - Choose pricing mode
In D17, set how prices are handled. Conservative or Mid shows the package price in F20. Manual lets you type one total in F19 like a broker package order. Start with Conservative. In this run, you’ll see an overall collar price of 397.84.
Want to test fills or credits more freely? Switch to Manual, and tweak the total (for instance, you can enter a price of $399.5):
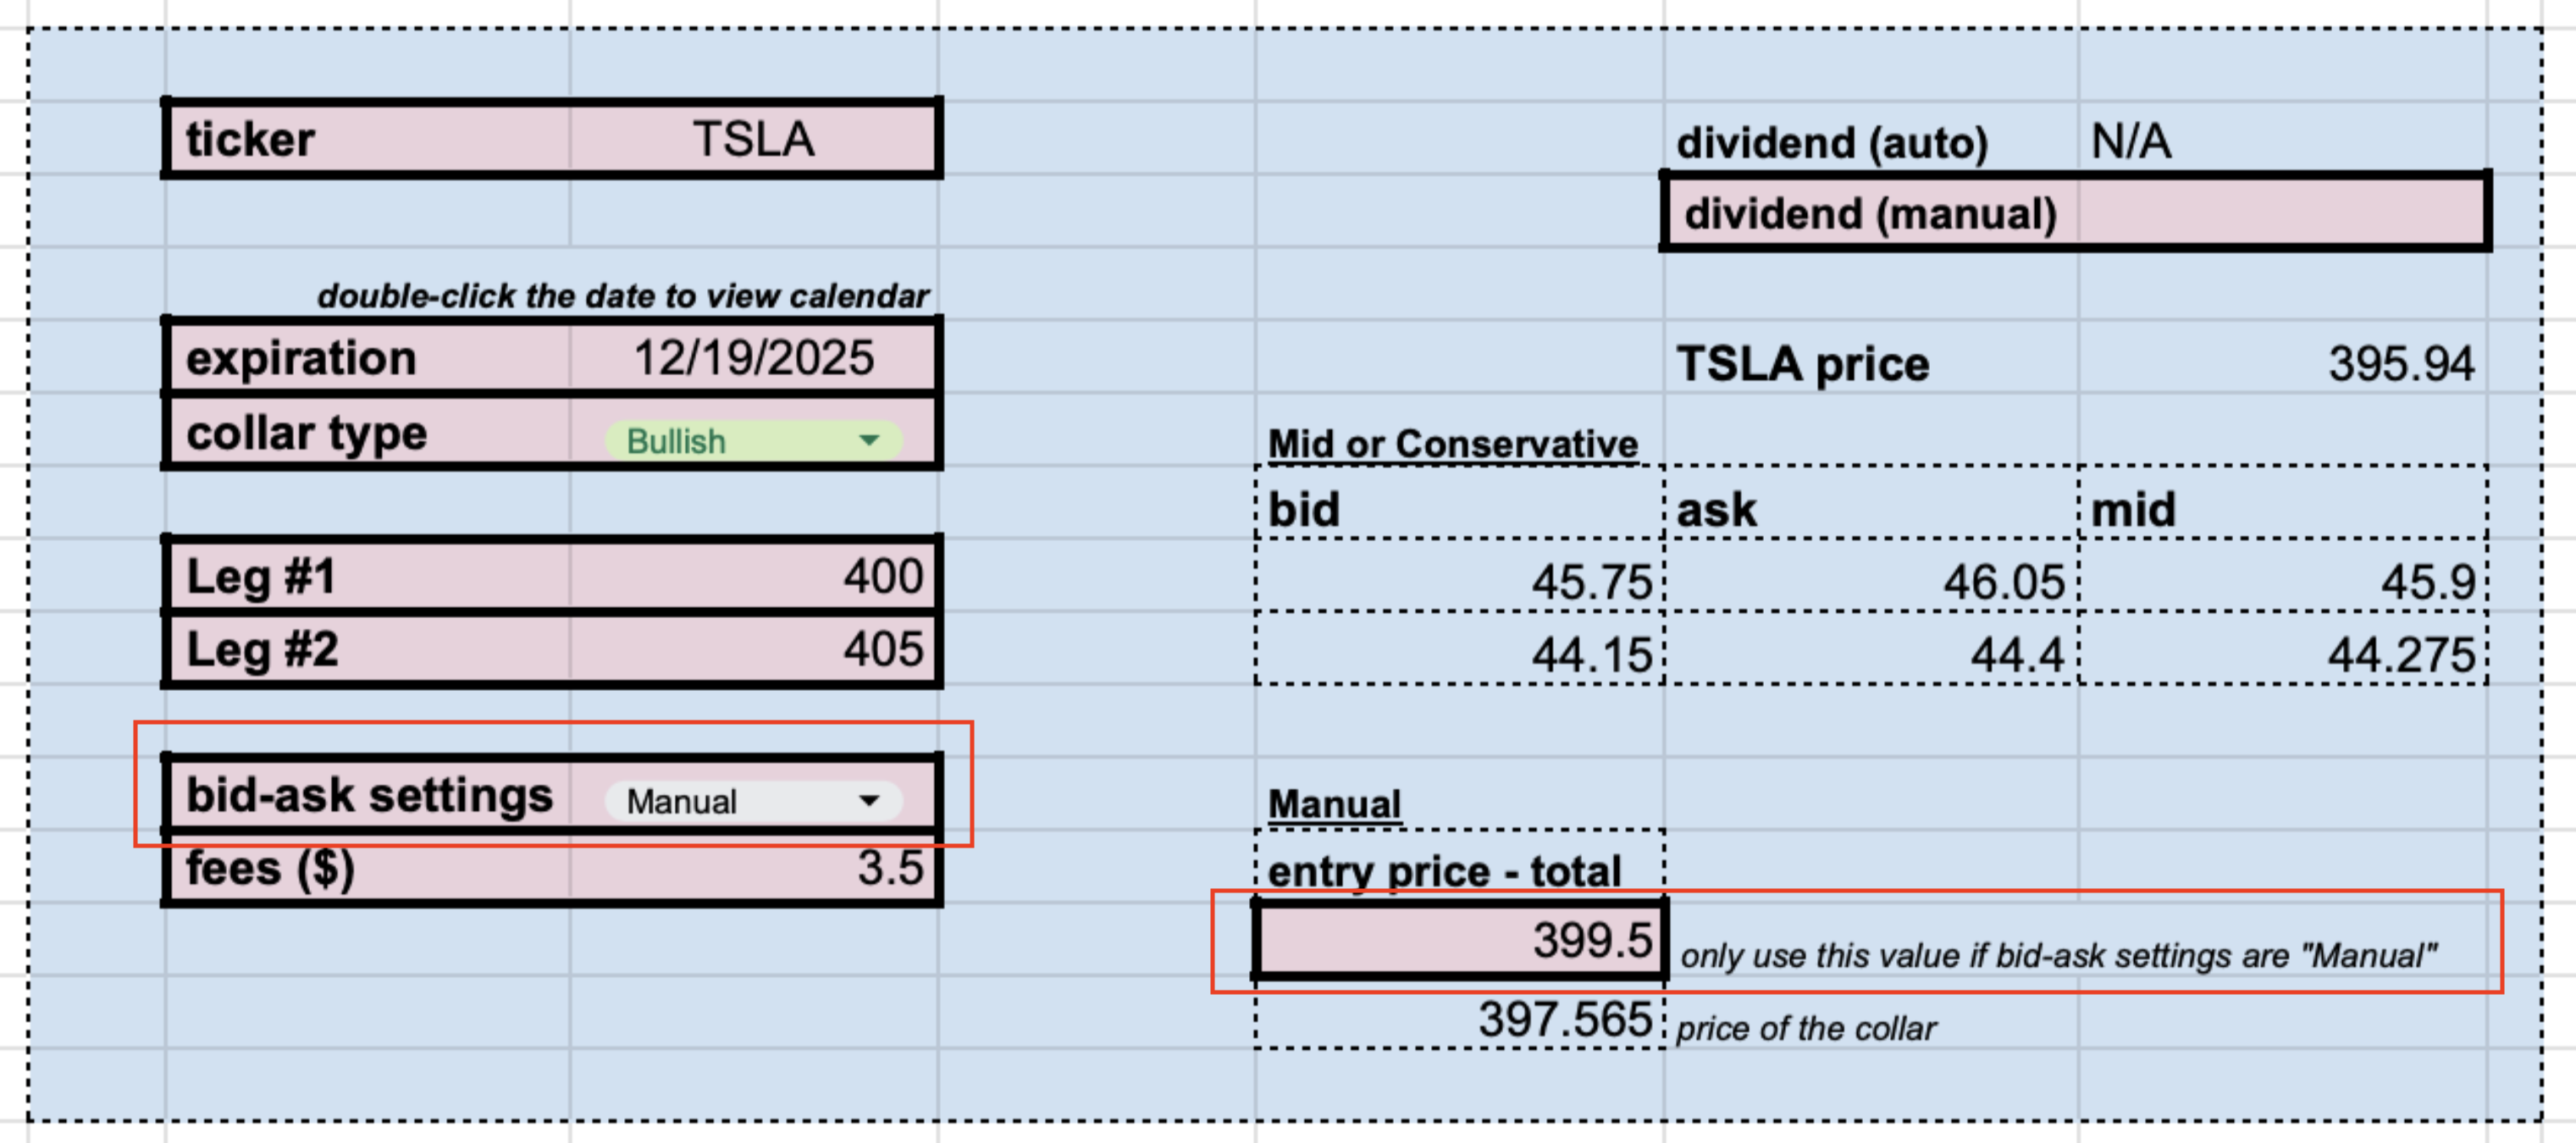
You will be able to see how this change impacts the P&L of your strategy in the next steps. Now, just for the sake of our example, we will stick to “Conservative.”
Step 5 - Add fees
Enter your broker fees in dollars. For instance, go for $3.5 here if that matches your account. Small costs matter when you are hunting near zero cost collars.

Step 6 - Check dividends
Cell H8 shows the next dividend amount and the sheet includes it in P&L since the collar uses 100 shares. This assumes the options expire after the ex dividend date. You can override in H9. For TSLA you’ll see N/A since it does not pay a dividend right now.

Step 7 - Review the P&L table
Scan A24:H70. You’ll see how stock, put, and call combine at different expiration prices. If a dividend exists and lands before expiry, it is included. This is where you confirm the shape of the payoff band you built.
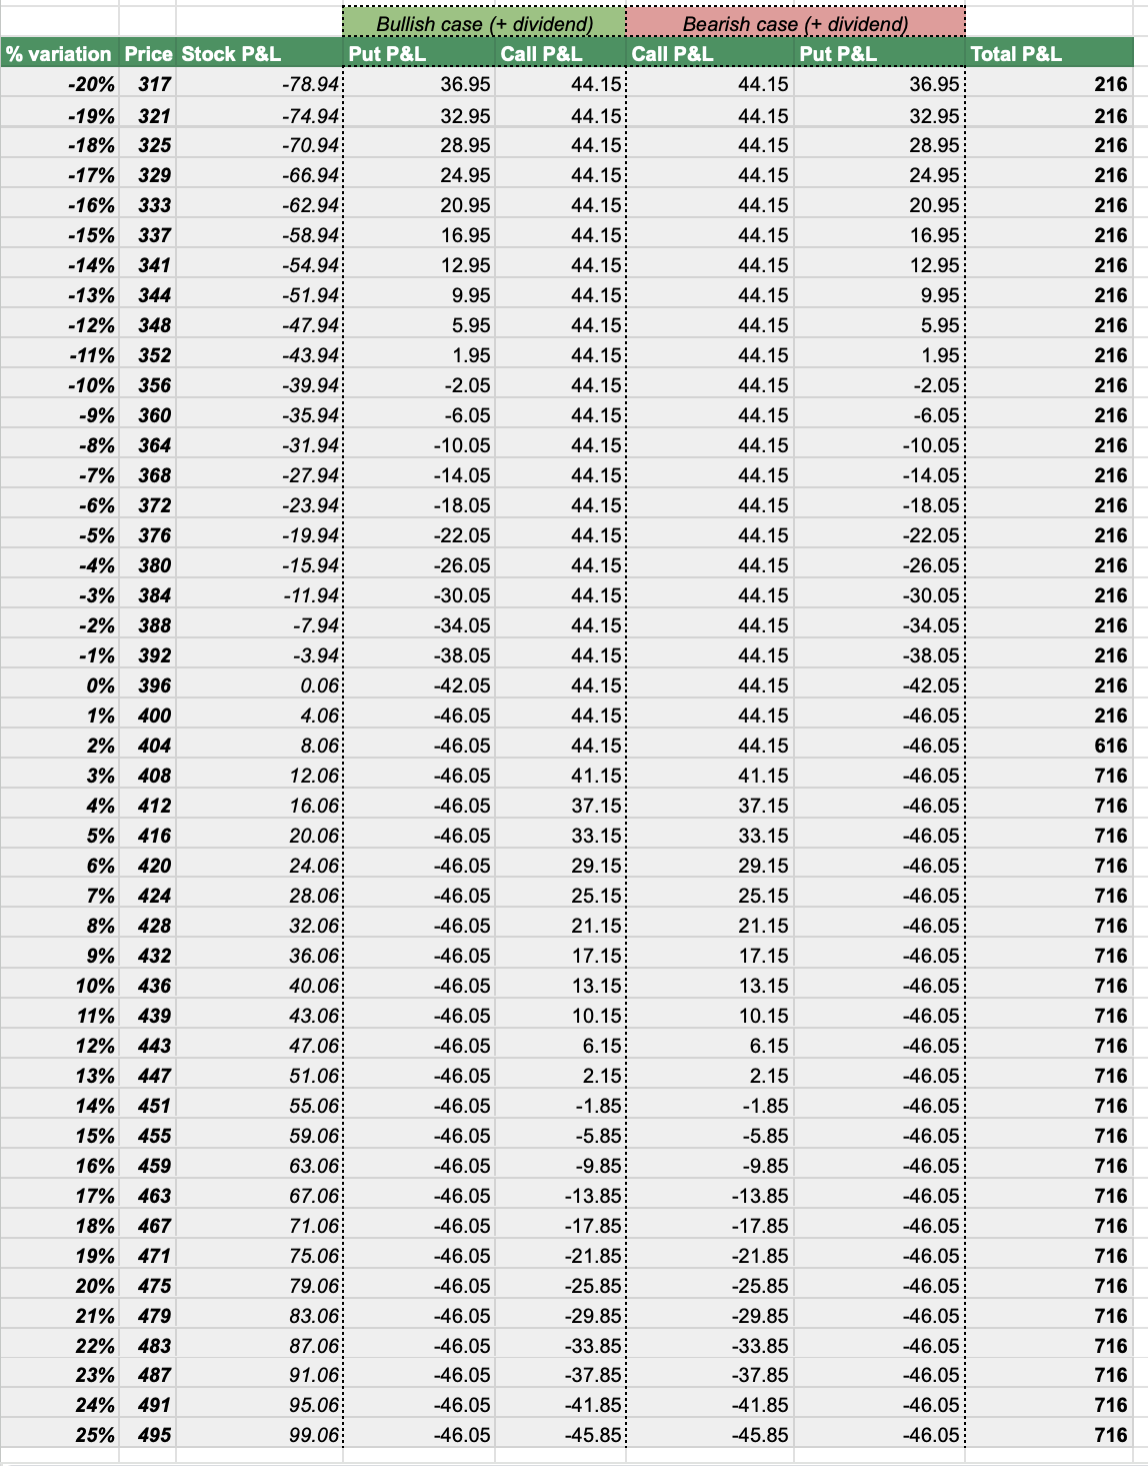
Step 8 - Read the chart and summary
Look at the payoff plot and the summary below it for dollar and percent returns. In this setup the annualized worst case is 2.04 percent, best case is 6.77 percent (therefore, you either earn less than the risk-free return, or more). Dollar outcomes show $216 in the worst case and $716 if price finishes at your cap.
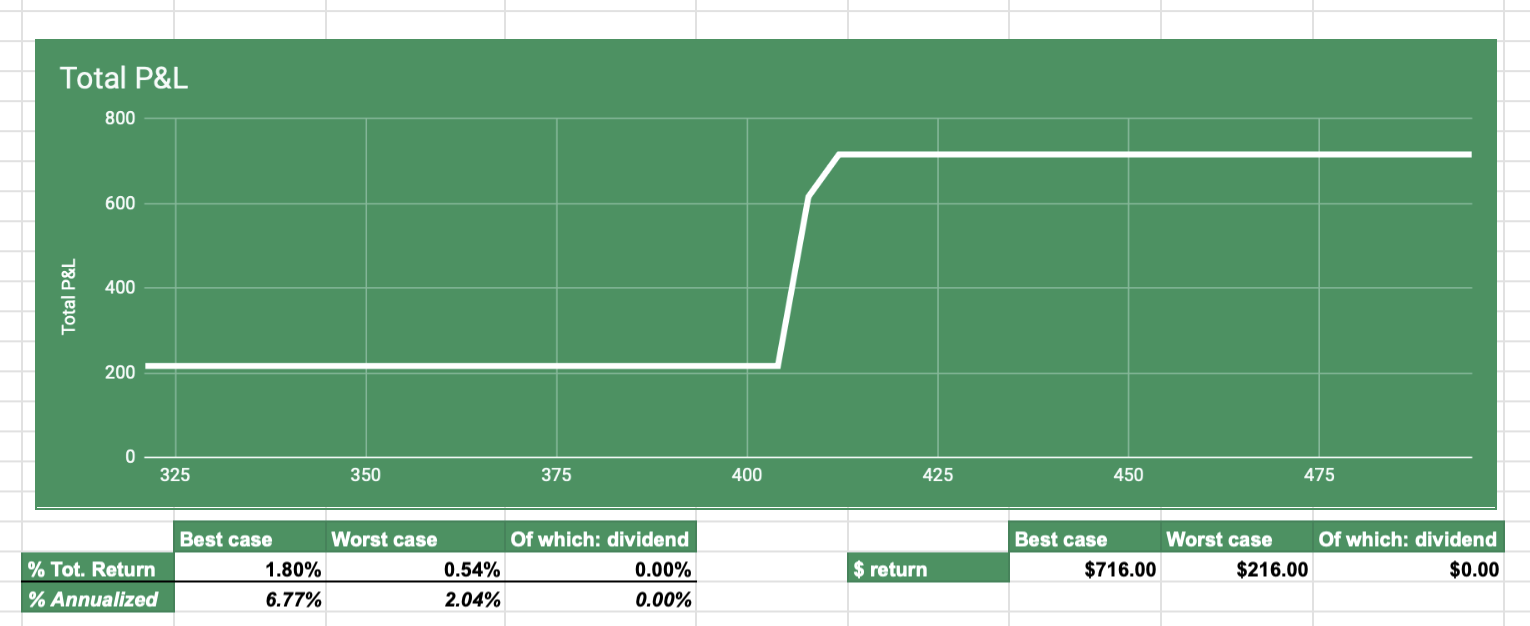
Step 9 - Check the % Return chart
Open the % Return chart to see best and worst case percentages and how much of the return comes from dividends when applicable. This makes it easy to judge whether the collar is low cost, zero cost, or even a small credit after fees.

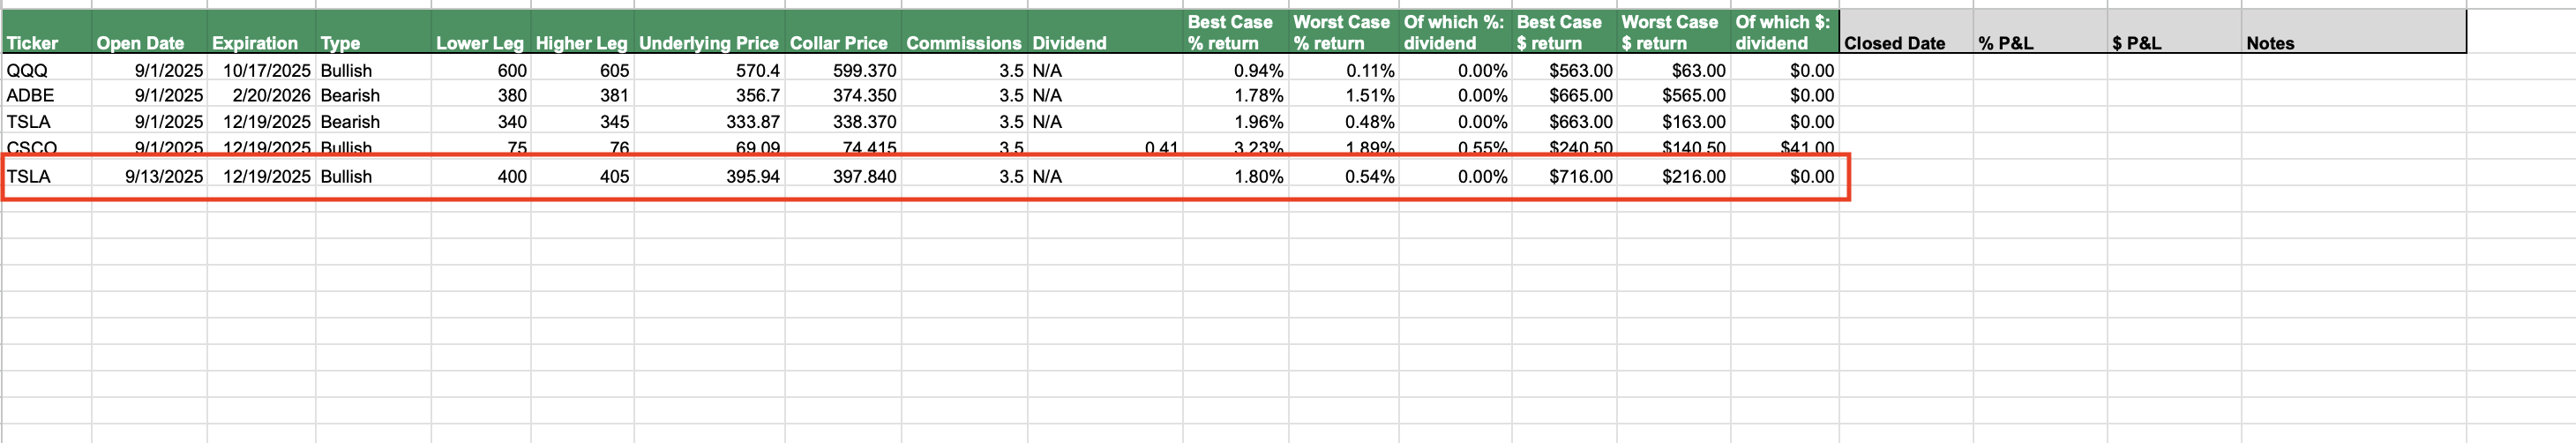
Step 10 - Log the trade
If it looks good, copy the 2nd row in CALCULATOR:
Now switch to TRADE LOG, click the first empty cell in column A, and paste with Ctrl + Shift + V. You now have a clean record of the collar you evaluated, ready for follow ups and performance tracking.
Read More:
ACCESS THE COLLAR STRATEGY CALCULATOR TEMPLATE HERE
Learn how to scan for collars with more or less than 100 shares with Option Samurai
AUTHOR
 Gianluca LonginottiFinance Writer - Traders Education
Gianluca Longinotti is an experienced trader, advisor, and financial analyst with over a decade of professional experience in the banking sector, trading, and investment services.
REVIEWER
 Leav GravesCEO
Leav Graves is the founder and CEO of Option Samurai and a licensed investment professional with over 19 years of trading experience, including working professionally through the 2008 financial crisis.