Collars With Less (or More) Than 100 Shares: Locking in Profit Your Way
Published on June 11, 2025Reviewed by Leav Graves
A traditional collar involves buying 100 shares of stock, selling a call option, and buying a protective put - essentially locking in a price range where your profit or loss is capped. It's often used during earnings or periods of high uncertainty, especially if you already own the stock and want to preserve gains while still collecting dividends.
But here’s something few people realize: you don’t need to stick to exactly 100 shares. With our custom scan feature, you can design a collar using fewer or more than 100 shares - giving you more control over risk, capital, and payoff.
Let’s walk through how this works, and how you can spot clever trade setups - including near-riskless, arbitrage-style opportunities - using the scanner.
KEY TAKEAWAYS
- You can build a collar strategy with less or more than 100 shares to customize risk, capital, and payoff.
- If you own more than 100 shares in your collar you will have extra upside if the stock rallies, while owning less than 100 shares will reduce your exposure and add protection for the bearish case.
- Use the Custom Strategy Scanner to find and fine-tune collar setups, including low-risk or arbitrage-style opportunities.
What Is a Standard Collar?
The textbook version of the collar looks like this:
- Buy 100 shares of a stock
- Sell 1 call option (typically out-of-the-money)
- Buy 1 put option (typically out-of-the-money)
Your standard collar P&L chart will have the classic shape of a spread option strategy:
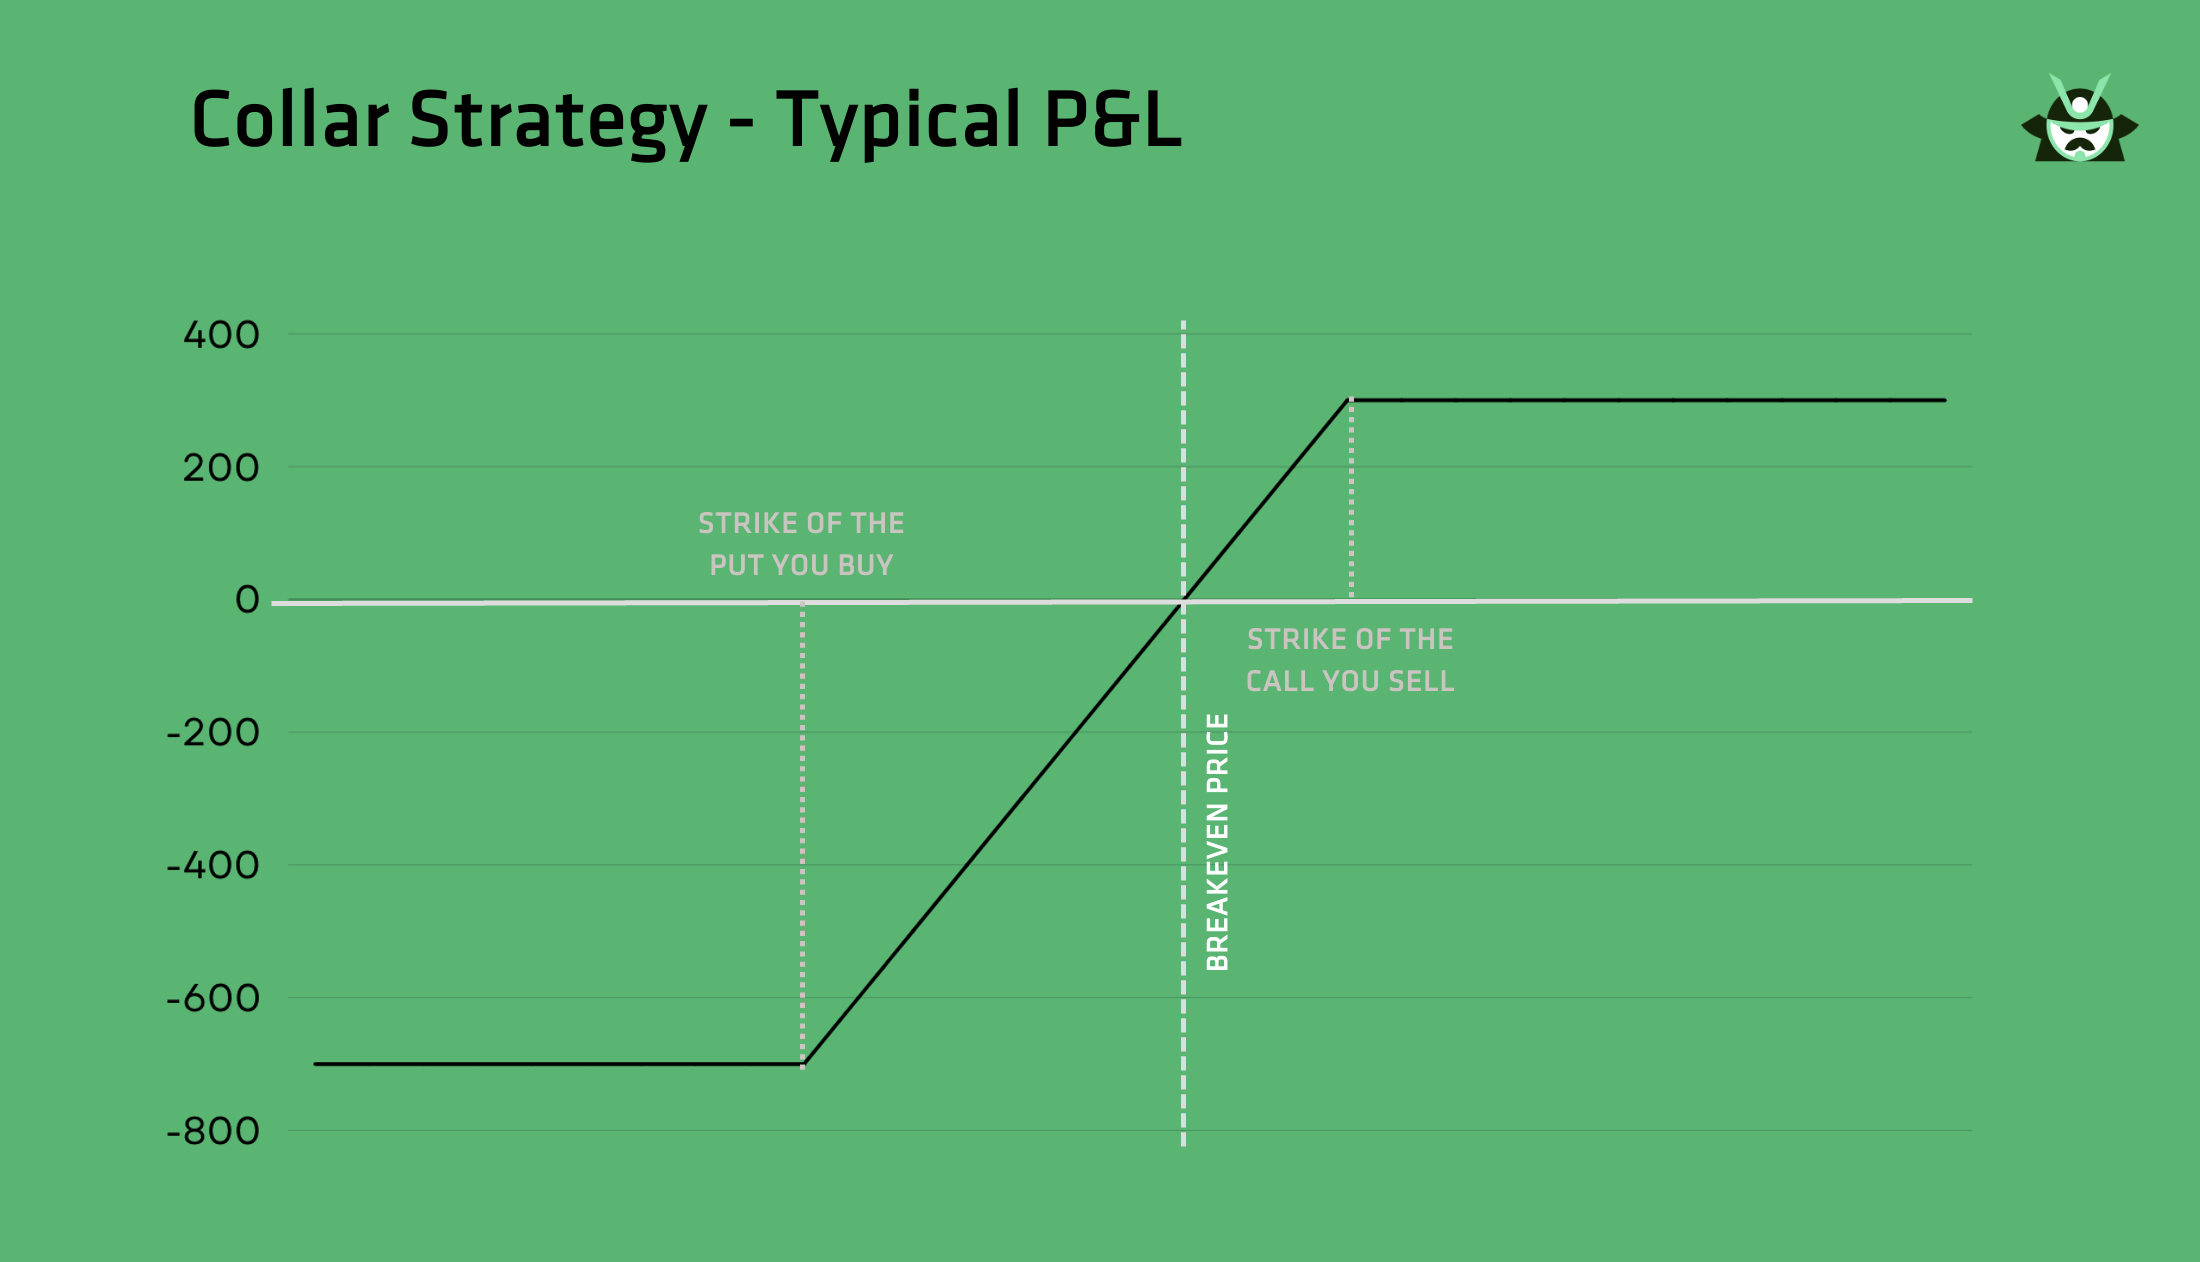
Your upside is capped by the call you sold, and your downside is protected by the put you bought. This strategy is often used as a hedge - for example, to lock in a gain after a big rally - while continuing to earn dividends and possibly exit the position on your own terms.
In flat or slightly bearish markets, this setup can deliver consistent results. As we will explain better toward the end of the article, you can also build a collar in a way to trade an arbitrage opportunity, with a return that will vary based on the risk-free rate.
Just to give you a practical example, here’s a classic collar built on MSFT using 100 shares:
- Buy 100 shares at $470.38
- Sell 1 call at the 455 strike
- Buy 1 put at the 435 strike
Your P&L chart would be the following:
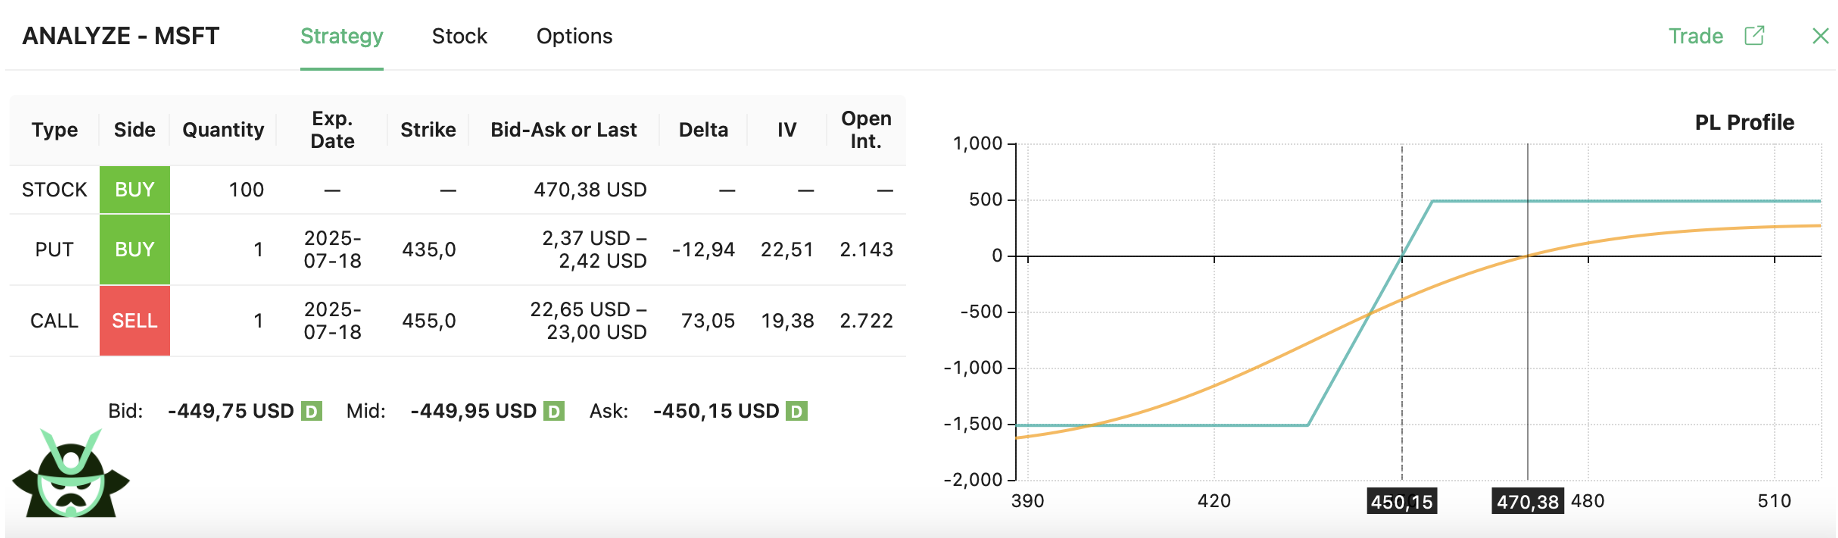
This creates a defined profit and loss range. As shown in the P&L chart, your maximum profit is capped once MSFT moves above the call strike, while your maximum loss is limited if the stock drops below the put strike. The result is a stable, hedged position - perfect for investors who want to lock in a trading range while maintaining dividend exposure and reducing downside risk.
What Happens With 125 Shares?
Now let’s adjust the collar: same strikes, but this time with 125 shares of MSFT. This is one of the many use cases for our options screener’s custom scan feature.
In this structure, you're still buying a put at 435 and selling a call at 455 - but you own more stock than the options cover. That gives you a hybrid payoff:
- Your first 100 shares are fully protected by the collar
- The extra 25 shares remain uncapped on the upside and fully exposed on the downside. Note that you can effectively control the risk of your trade with the number of “extra” shares (and, of course, you will need to take into account the distance between the strike prices). This is a clear way to think about the main reasons why you would want to trade a collar with more or less than 100 shares, it’s a risk control approach.
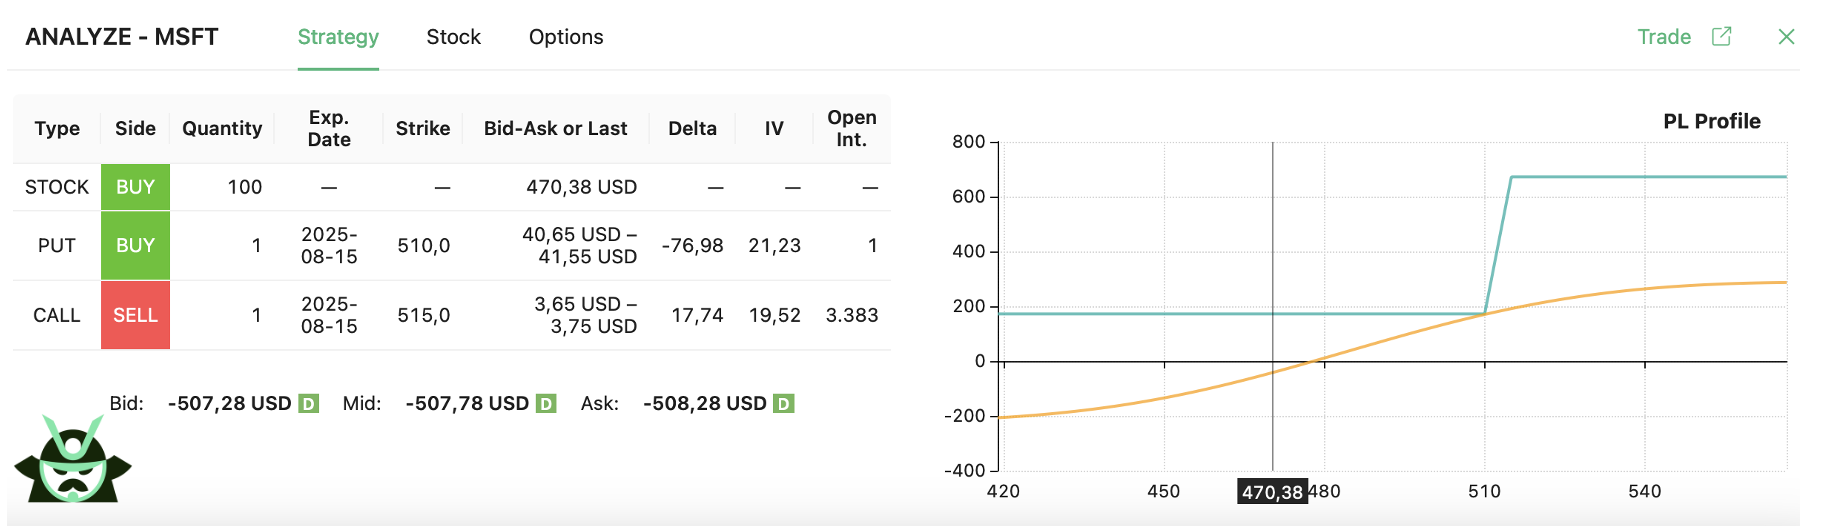
In fact, here is the P&L chart for the collar with 125 shares:
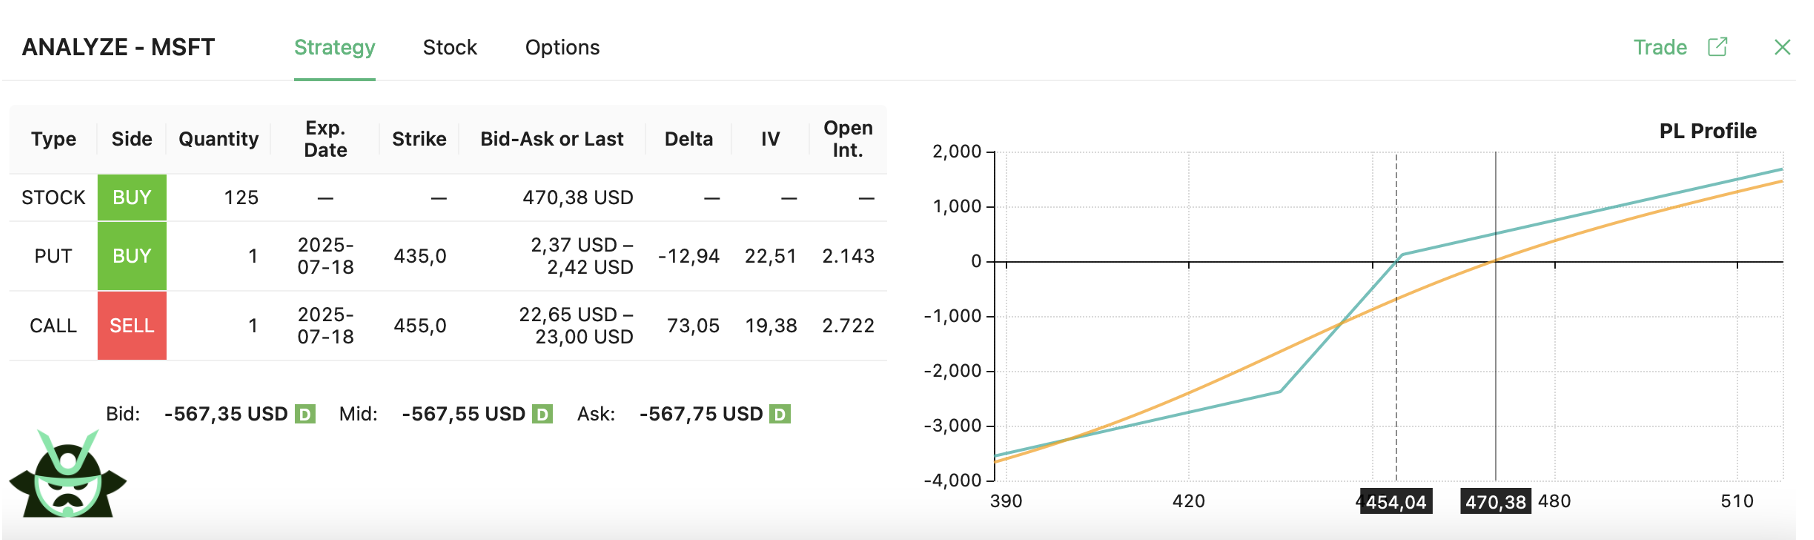
As shown in the chart, if MSFT rallies beyond the call strike, your P&L continues rising thanks to the 25 additional shares that aren’t capped. If the stock falls, the put protects only 100 shares, so you’re still partially exposed - but total risk remains contained.
This setup is ideal if you want to hedge most of your position while still benefiting from a possible breakout. It gives you controlled downside with optional upside participation.
To find this structure in the scanner:
- Start a New Scan
- Select “Custom” as the strategy type
- Add one stock leg, and set the quantity to 125 shares
- Add a put option leg (Buy)
- Add a call option leg (Sell)
- Apply filters based on strike moneyness, expiration, open interest, or net credit/debit depending on your target setup
The GIF below will give show you how you can build the strategy, you can just follow these steps and then add whichever filter you have in mind:
You can find this structure in our custom scanner by setting the stock leg to 125 shares, pairing it with a put and call at your desired strikes, and filtering based on expiration, moneyness, or premium.
What Happens With 75 Shares?
Now flip the structure: same strikes, but with only 75 shares of MSFT.
In this version, the options hedge more stock than you actually own - and that creates an asymmetric, overhedged payoff.
Your P&L chart would look exactly like this:
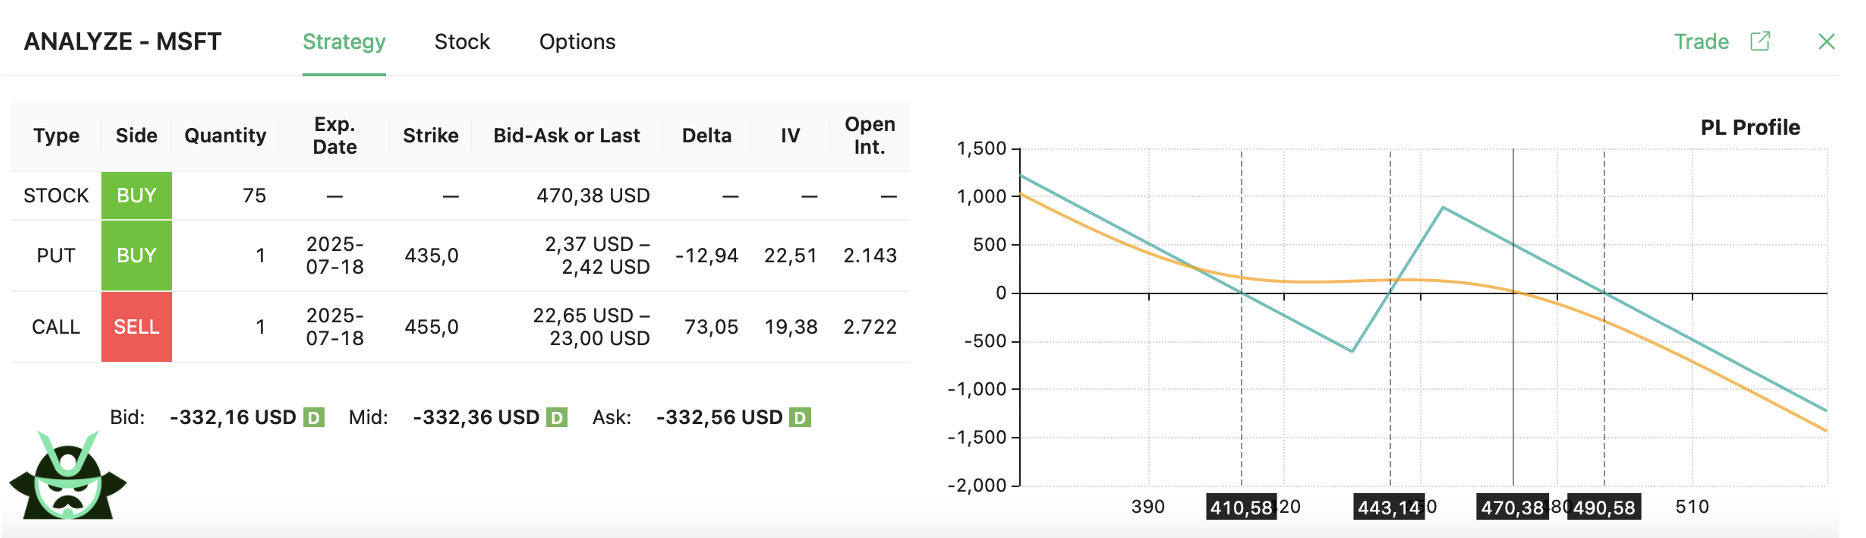
Here is what you should note from the chart above:
- If MSFT drops below $410.58, your position actually enters a profit zone. That’s because the long put covers 100 shares, but you only hold 75 - so the put overprotects you.
- Your maximum loss occurs if MSFT closes right around the put strike ($435), where the long put loses value but the stock hasn’t declined enough to offset it.
- If MSFT rises toward the call strike ($455), you hit a local profit peak, since the call generates income and your stock gains.
- But if MSFT rallies beyond $490.58, your losses begin increasing again - because you’re now obligated to deliver 100 shares (from the call) but only own 75, forcing you to buy 25 shares at market price.
- A note about the orange line, which represents the value of the trade before the expiration (and it is computed using the Black & Scholes model). As you can see, even if MSFT falls between $410.58 and $443.14 before the expiration, you will have a small profit. If you look at it like this, the 75-share collar will essentially be a bearish strategy.
This structure isn't for every situation, but it can work well when you're aiming for a more bearish tilt. Since you hold fewer shares than the options cover, you're overhedged on the downside, which means the protective put can generate profit even with a moderate drop in the stock. At the same time, your upside is limited, and if the stock rallies sharply, you're exposed to losses because you don’t have enough shares to deliver on the short call. On the flip side, just like with a covered call on fewer than 100 shares, the capital required is lower, so if the trade works, your percentage return is higher, since less money is tied up in the position.
To scan for this setup, configure the custom strategy tool with 75 shares of stock, 1 long put, and 1 short call. Filter by strike distance, premium collected, and expected move to isolate favorable risk/reward profiles.
Scan the Market for Collar-Based Arbitrage Opportunities
The flexibility of adjusting share size also opens the door to another use case: screening the market for near-riskless collar structures. Yes, these setups exist - and you can find them using our Custom Strategy Scanner. Just follow these steps:
- Select “New Scan”
- Go to the “Custom” strategy type
- Add three legs in this exact order:
• One stock leg (any share quantity)
• One option leg to buy a put
• One option leg to sell a call - Sort the results by Breakeven, and look for rows where it shows “N/A” - this typically indicates a flat or locked-in payoff.
- Use the second sort column to rank the remaining trades by Return, Net Credit, or similar metrics - since all N/A breakevens will tie on the first sort, this helps you surface the best candidates.
In other words, your scan will normally look like this::
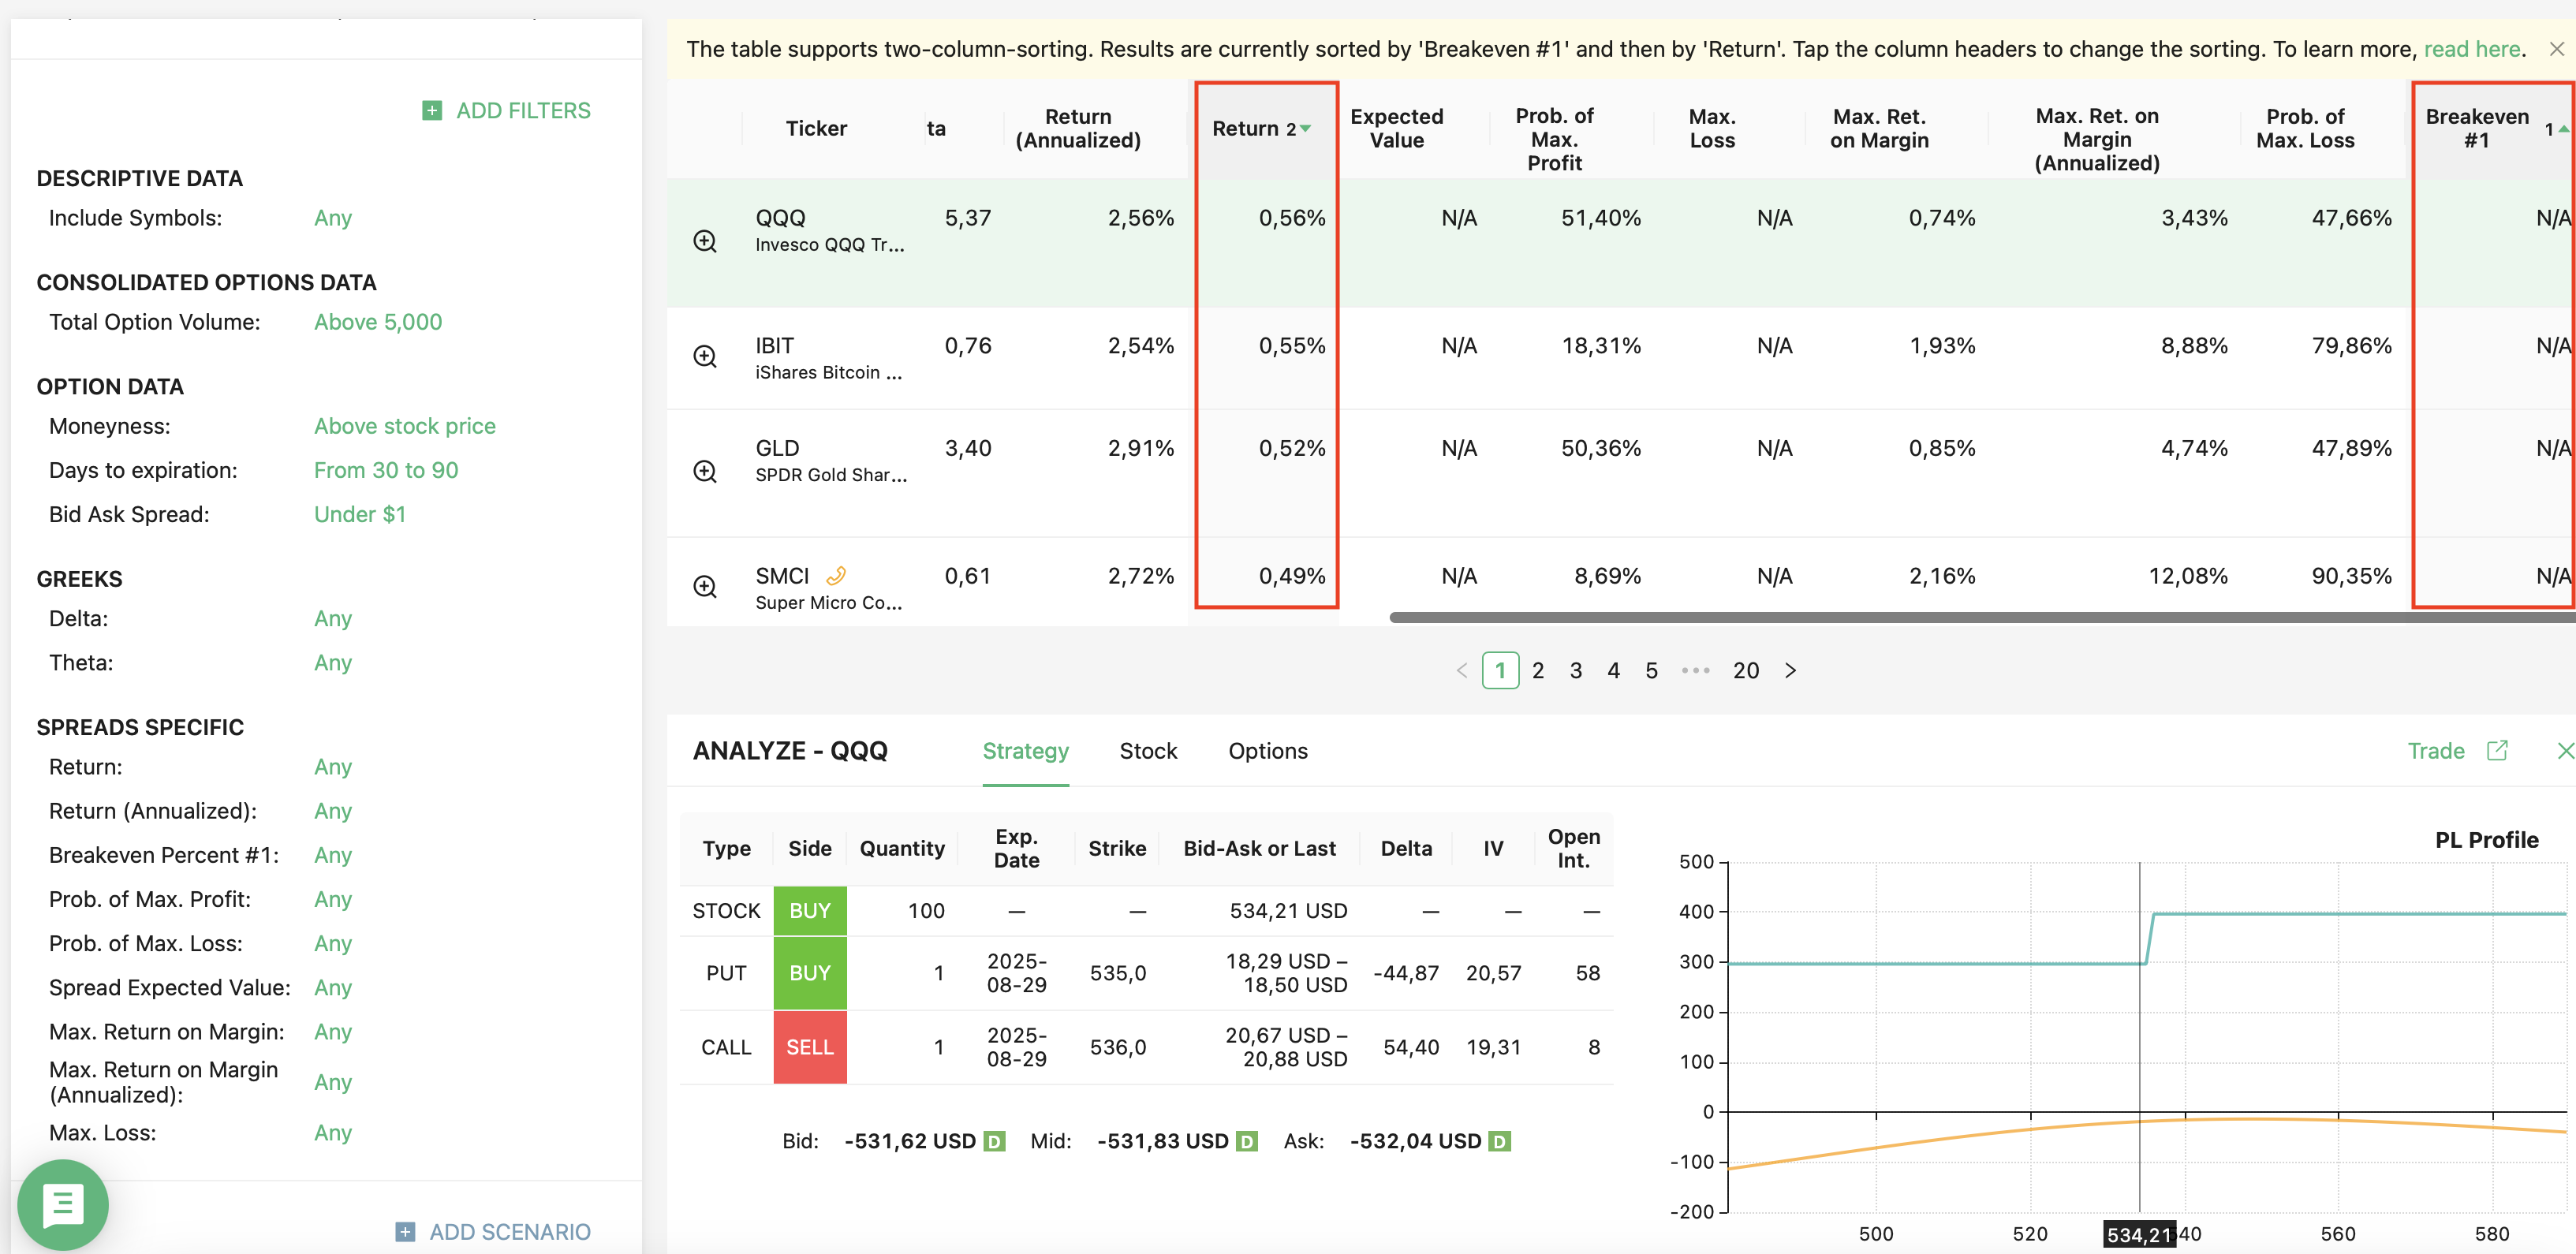
In the end, you will be able to find a trade like this one below:
As you can see, you cannot lose with this trade. Is it really free money? Well, yes, but you could just as easily consider buying Treasuries to have a similar yearly return rate. It’s a strategy you can do with your money if you feel you will soon face a period in which you won’t be able to follow the market and don’t want your funds to sit idle in your account. In fact, according to the put-call parity, you will notice that your average rate of return will be around the same as putting the money in the Treasuries market and buying a spread.
In general, therefore, the expected return will hover just below or slightly above the risk-free rate (close to the risk free rate if you are in the most profitable side of the P&L, but you may end up earning less if you find yourself on the other side of the chart). If you're using margin to fund the stock leg, check the margin interest rate charged by your broker to ensure the trade is still profitable.
These setups are hard to spot manually - but easy to uncover with the scanner once you know how to filter for them. In general, notice that, as a retail investor, you will normally find it hard to catch arbitrage opportunities. However, if you are aiming to have a return that is close to the risk-free rate, this will be possible.
Try It Now in the Scanner
Whether you’re looking to protect gains, limit risk, or simulate risk-free-style trades with smart collar setups, you can build them all in our Custom Strategy Scanner. Set your share size, pick your strikes, and start scanning.
Try building your own 75-share or 125-share collar today on our options screener, or play around with its riskless variation.
Read More
Our article on arbitrage with options (Options Arbitrage Strategies Explained)
Our article about the collar strategy (Simplifying the Collar Option Strategy)
Our guide about the custom options strategy screener (Custom Options Strategy Screener Guide)
AUTHOR
 Gianluca LonginottiFinance Writer - Traders Education
Gianluca Longinotti is an experienced trader, advisor, and financial analyst with over a decade of professional experience in the banking sector, trading, and investment services.
REVIEWER
 Leav GravesCEO
Leav Graves is the founder and CEO of Option Samurai and a licensed investment professional with over 19 years of trading experience, including working professionally through the 2008 financial crisis.