Earnings Play on Stocks You Own with the Custom Scan - Shares and Long Straddle
Published on June 25, 2025Reviewed by Leav Graves
A traditional long straddle involves buying a call and a put at the same strike, typically at-the-money, to profit from large moves in either direction. It's a favorite around earnings season, when volatility spikes and traders expect big swings, but it comes with a catch: you don’t own the stock, and the risk can be high if the move doesn’t come.
But here’s something few traders explore: you can combine a straddle with stock ownership. Instead of going in with zero delta and maximum exposure, you hold a portion of the underlying (say, for instance, 75 shares) and layer on a straddle with 1 call and 1 put. The result? You keep directional exposure while adding optionality in both directions.
Let’s break down how this works and how to use our Custom Strategy Scanner to find these clever earnings trades.
KEY TAKEAWAYS
- If you already own shares, you can add a long call and a long put to profit from large price moves around earnings in either direction.
- This structure lets you stay invested while introducing downside protection and upside amplification through optionality.
- Use the Custom Strategy Scanner to find stocks with high implied volatility, liquid options, and upcoming earnings to build these hybrid setups.
What Is a Standard Straddle?
The textbook long straddle looks like this:
- Buy 1 call at the ATM strike
- Buy 1 put at the ATM strike
- No stock position
Your P&L chart forms a classic “V” shape, as you can see below:
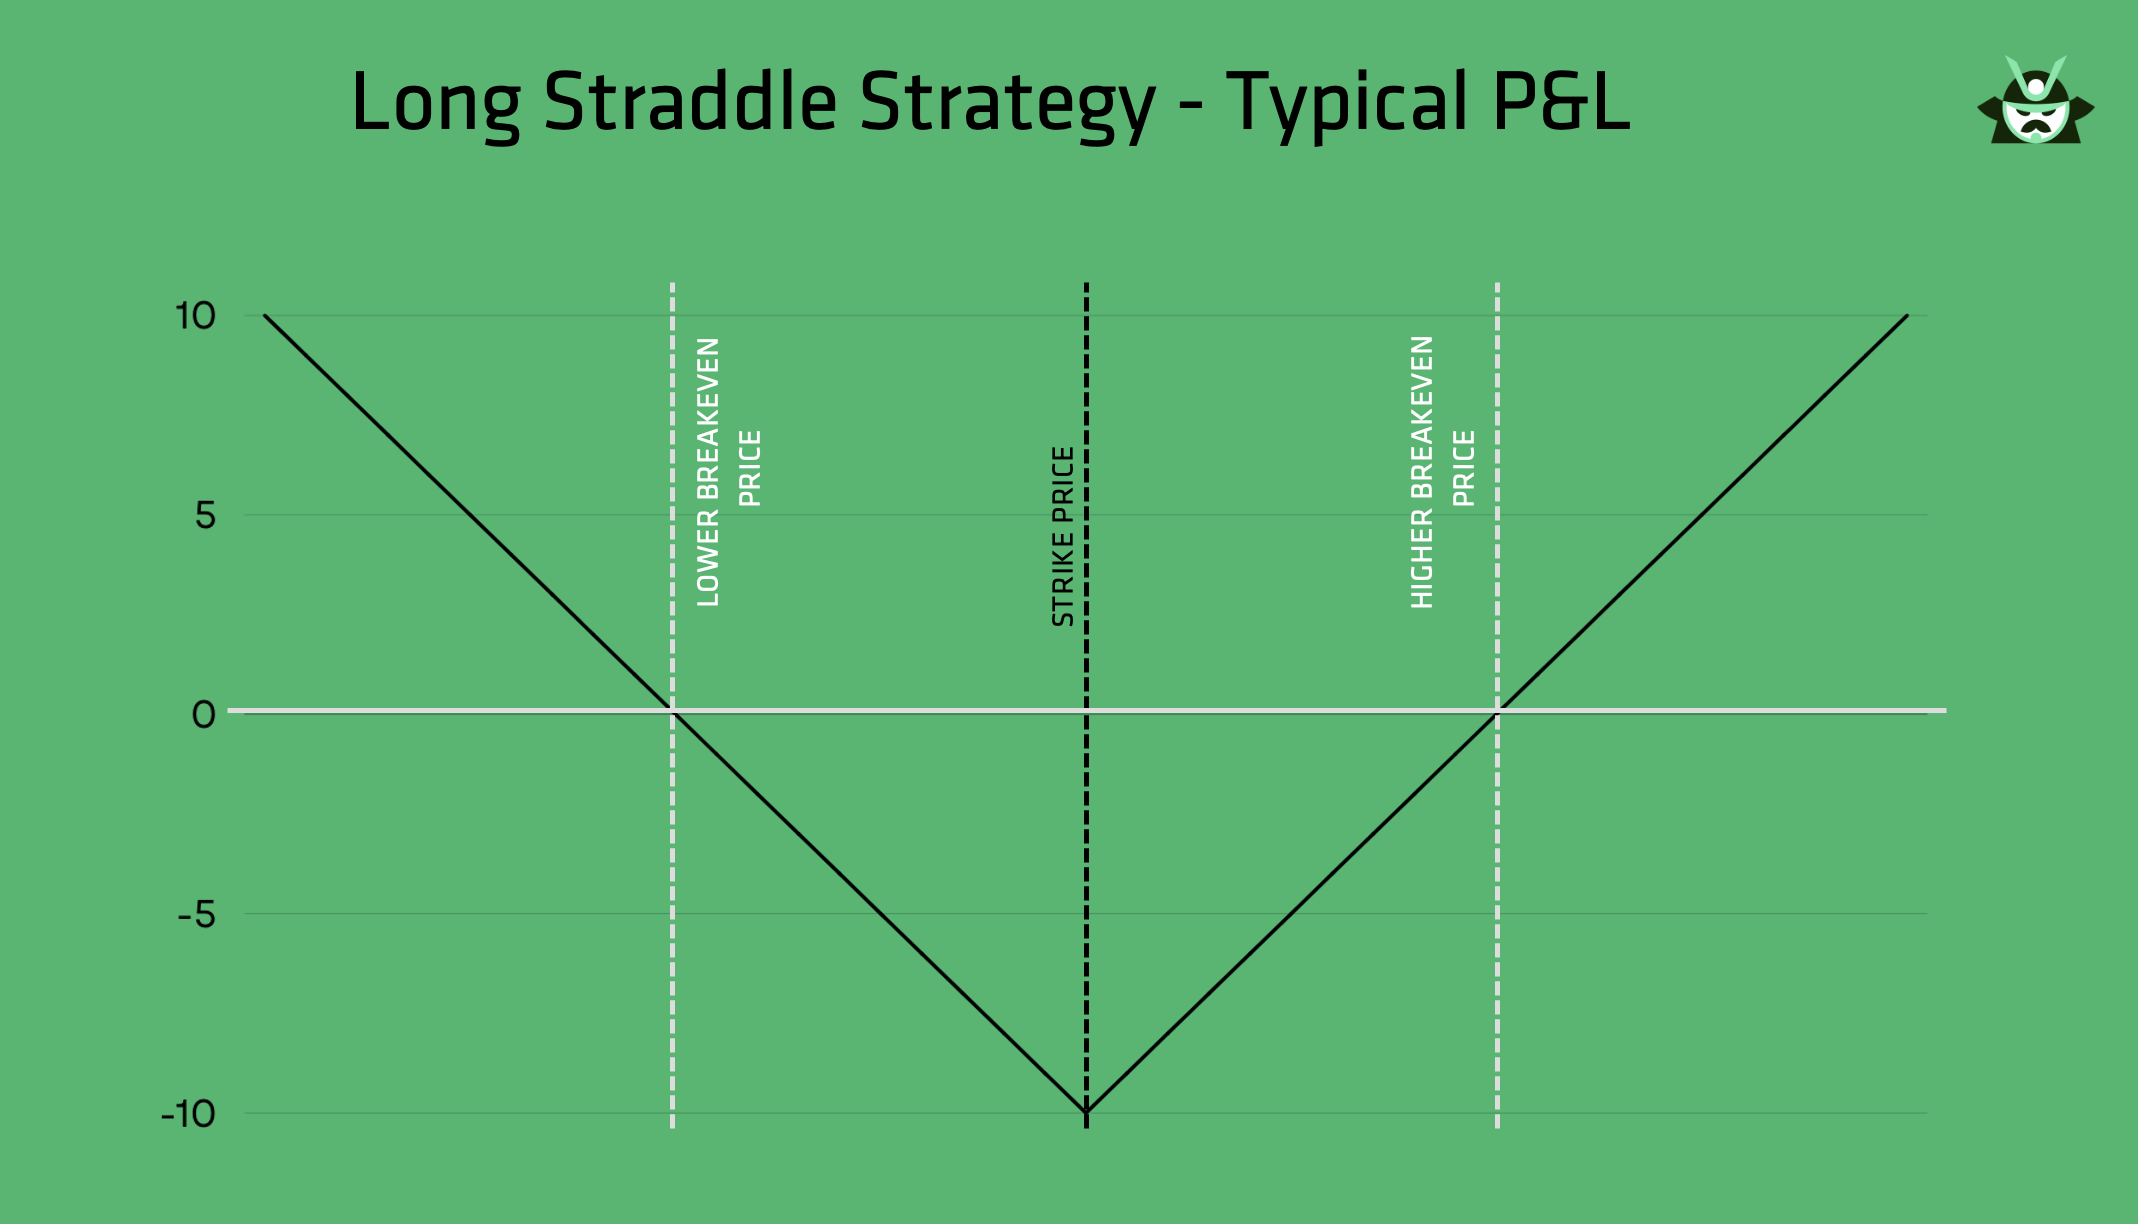
If the stock makes a large move in either direction, you profit. But if it trades sideways, the time decay from both options erodes your position. The maximum loss? The total premium paid.
What Happens If You Add Shares to the Picture?
Now let’s rework the setup. Instead of holding no stock, let’s say you own 75 shares of the underlying. Then you add a 1-lot long call and 1-lot long put, both at the same strike.
This hybrid structure changes everything:
- You still benefit from a big move in either direction (thanks to the straddle), although it will take a large downside move for the underlying stock to make you earn money (in fact, this is probably best seen as a way to reduce your losses if the stock price crashes while still keeping a bullish bias)
- You also carry directional delta from the stock
Here’s what the risk profile looks like:
- If the stock rises, you profit from the 75 shares plus the long call.
- If the stock drops, the put starts gaining, partially offsetting losses from the shares.
- If it doesn’t move much, you lose the net premium on the straddle. This is your worst-case scenario but, assuming you are bullish for the long-term, it is fair to expect to profit from your shares at some point. Furthermore, you can always reopen the strategy during the next earnings season.
Compared to a standard straddle, this is a strategy that works for anyone who has an optimistic outlook on a stock and wants to introduce some protection and increase the bullish bias right before earnings. An option trader that simply trades long straddle is generally not interested in the long term prospect of the company, and does not own any shares.
The easiest way to see the difference between a classic long straddle and a straddle layered on stock is to compare them side by side. Below are two trades on AAPL, both using the same strike price ($210) and expiration.
Trade 1 - Classic Long Straddle (No Stock)
With AAPL trading at $198.78, suppose you do this:
- Buy 1 call @ 210
- Buy 1 put @ 210
- No shares owned
This is the textbook straddle: a delta-neutral, pure volatility play. Your P&L profile will look like this:
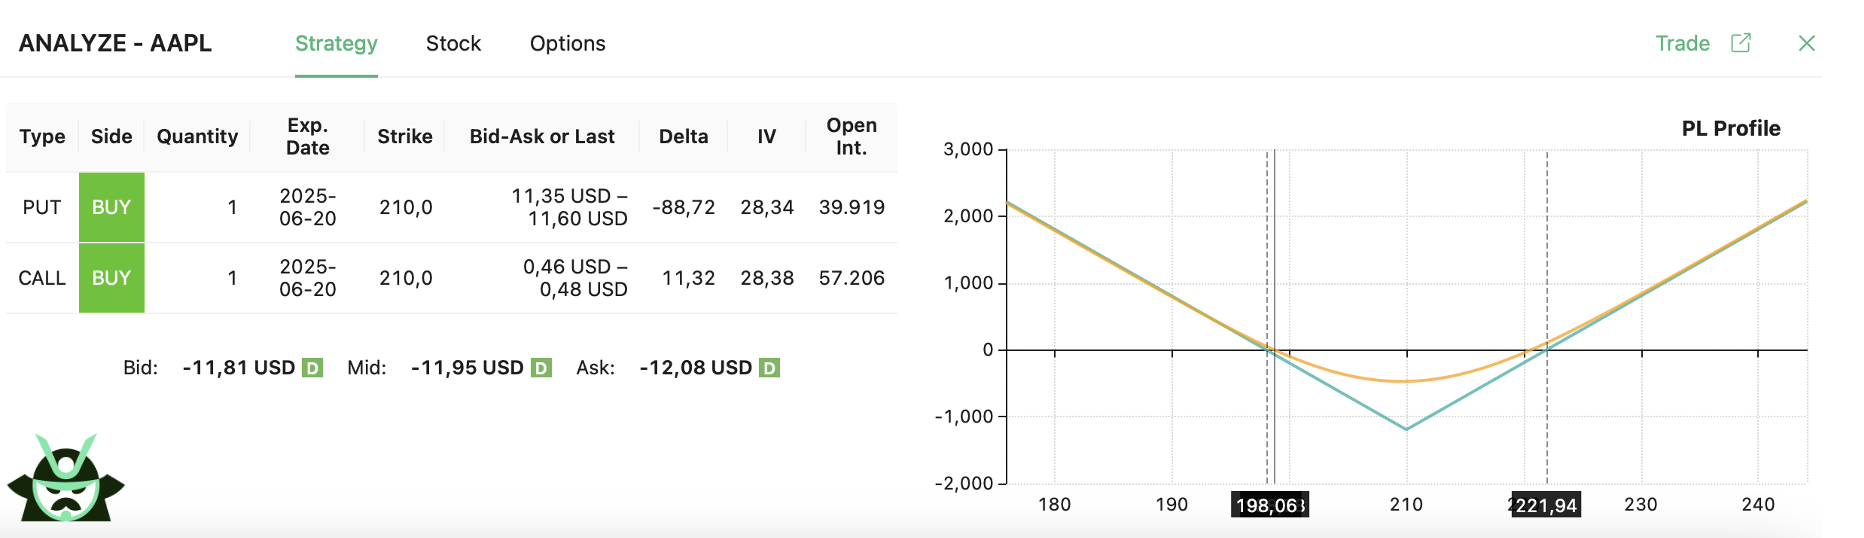
Your maximum loss is limited to the total premium paid (approximately $12 in this case), and your breakeven points are symmetric around the strike. However, if the stock doesn’t move enough, both options decay and you lose the full premium.
Note down the breakeven points (they’ll be useful when we compare this strategy with its variation in the next section):
- Lower breakeven: $198.06
- Upper breakeven: approximately $221.94
This creates a tighter zone where profit is possible, but exposes you to total premium loss if the stock stays flat. Notice that the strike price of your straddle strongly affects your strategy. In our example, AAPL was trading at $198.78 and we went for two $210 options. This produced a very bearish trade, in the same way as picking two $185 options would have made it strongly bullish. The farther your strikes are from the current price, the more directional bias you introduce. In general, most people will go for ATM options to have a more balanced risk profile.
Trade 2 - Long Straddle + 75 Shares
With AAPL still trading at $198.78, let’s say you do the following:
- Buy 75 shares @ $198.78
- Buy 1 call @ 210
- Buy 1 put @ 210
Your P&L profile will have this shape:
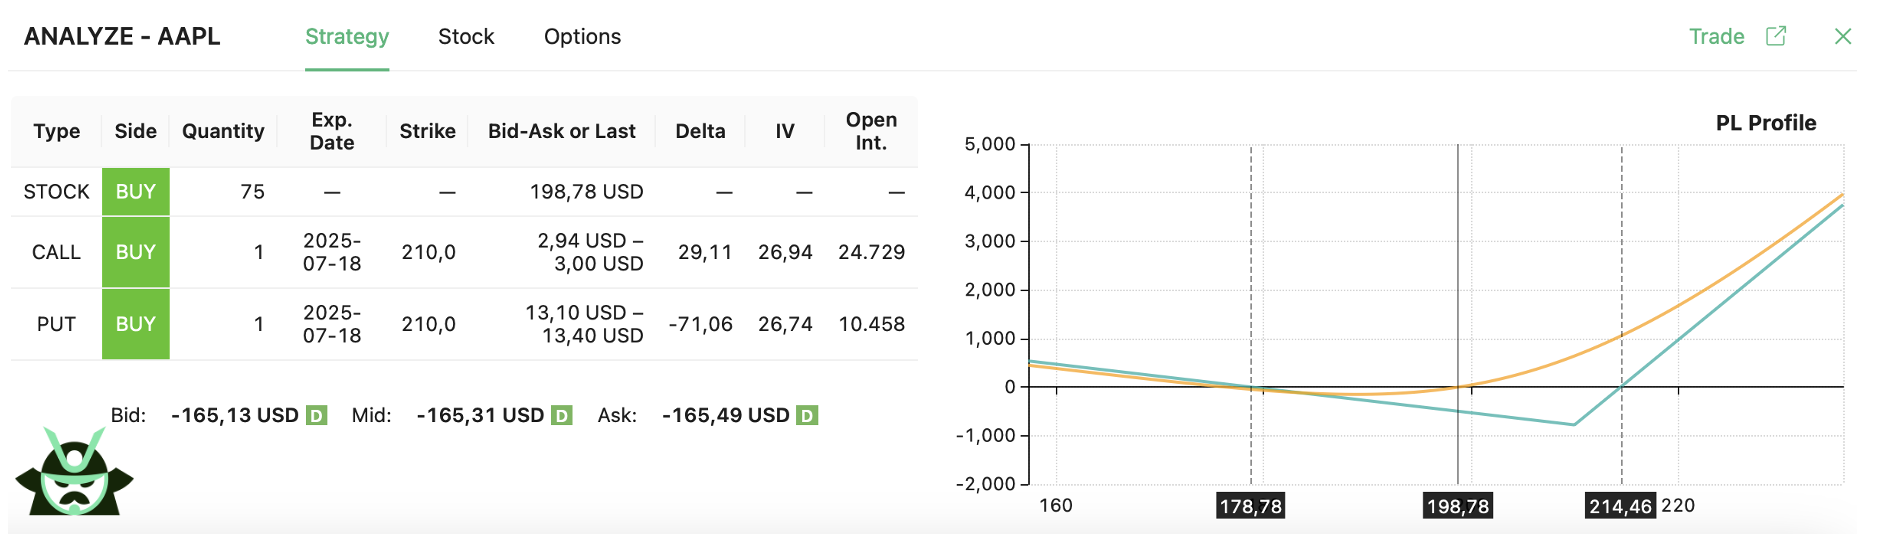
This hybrid setup introduces partial directional exposure and changes the risk/reward profile:
- If the stock rises, you benefit from both the long shares and the call option. At expiration, you’ll want AAPL to be above $214.46 (much lower compared to the $221.94 breakeven point of the previous strategy)
- If the stock falls, the put helps offset some of the losses from the shares. Notice that, here, your breakeven point is really far ($178.78). This means that things need to go really bad for AAPL for you to make money. But, at least, you are protecting a part of your capital by reducing the losses.
In fact, let us compare the 2 trades with a simple table:
Feature | Classic Long Straddle | Long Straddle + 75 Shares |
Max Loss | Above 1,000 | Below 1,000 |
Upper Breakeven | $221.94 | $214.46 |
Lower Breakeven | $198.06 | $178.78 |
Potential Profit | Unlimited | Unlimited |
Use Case | Expect large move but no bias | Already own the stock, bullish, want profit + hedge |
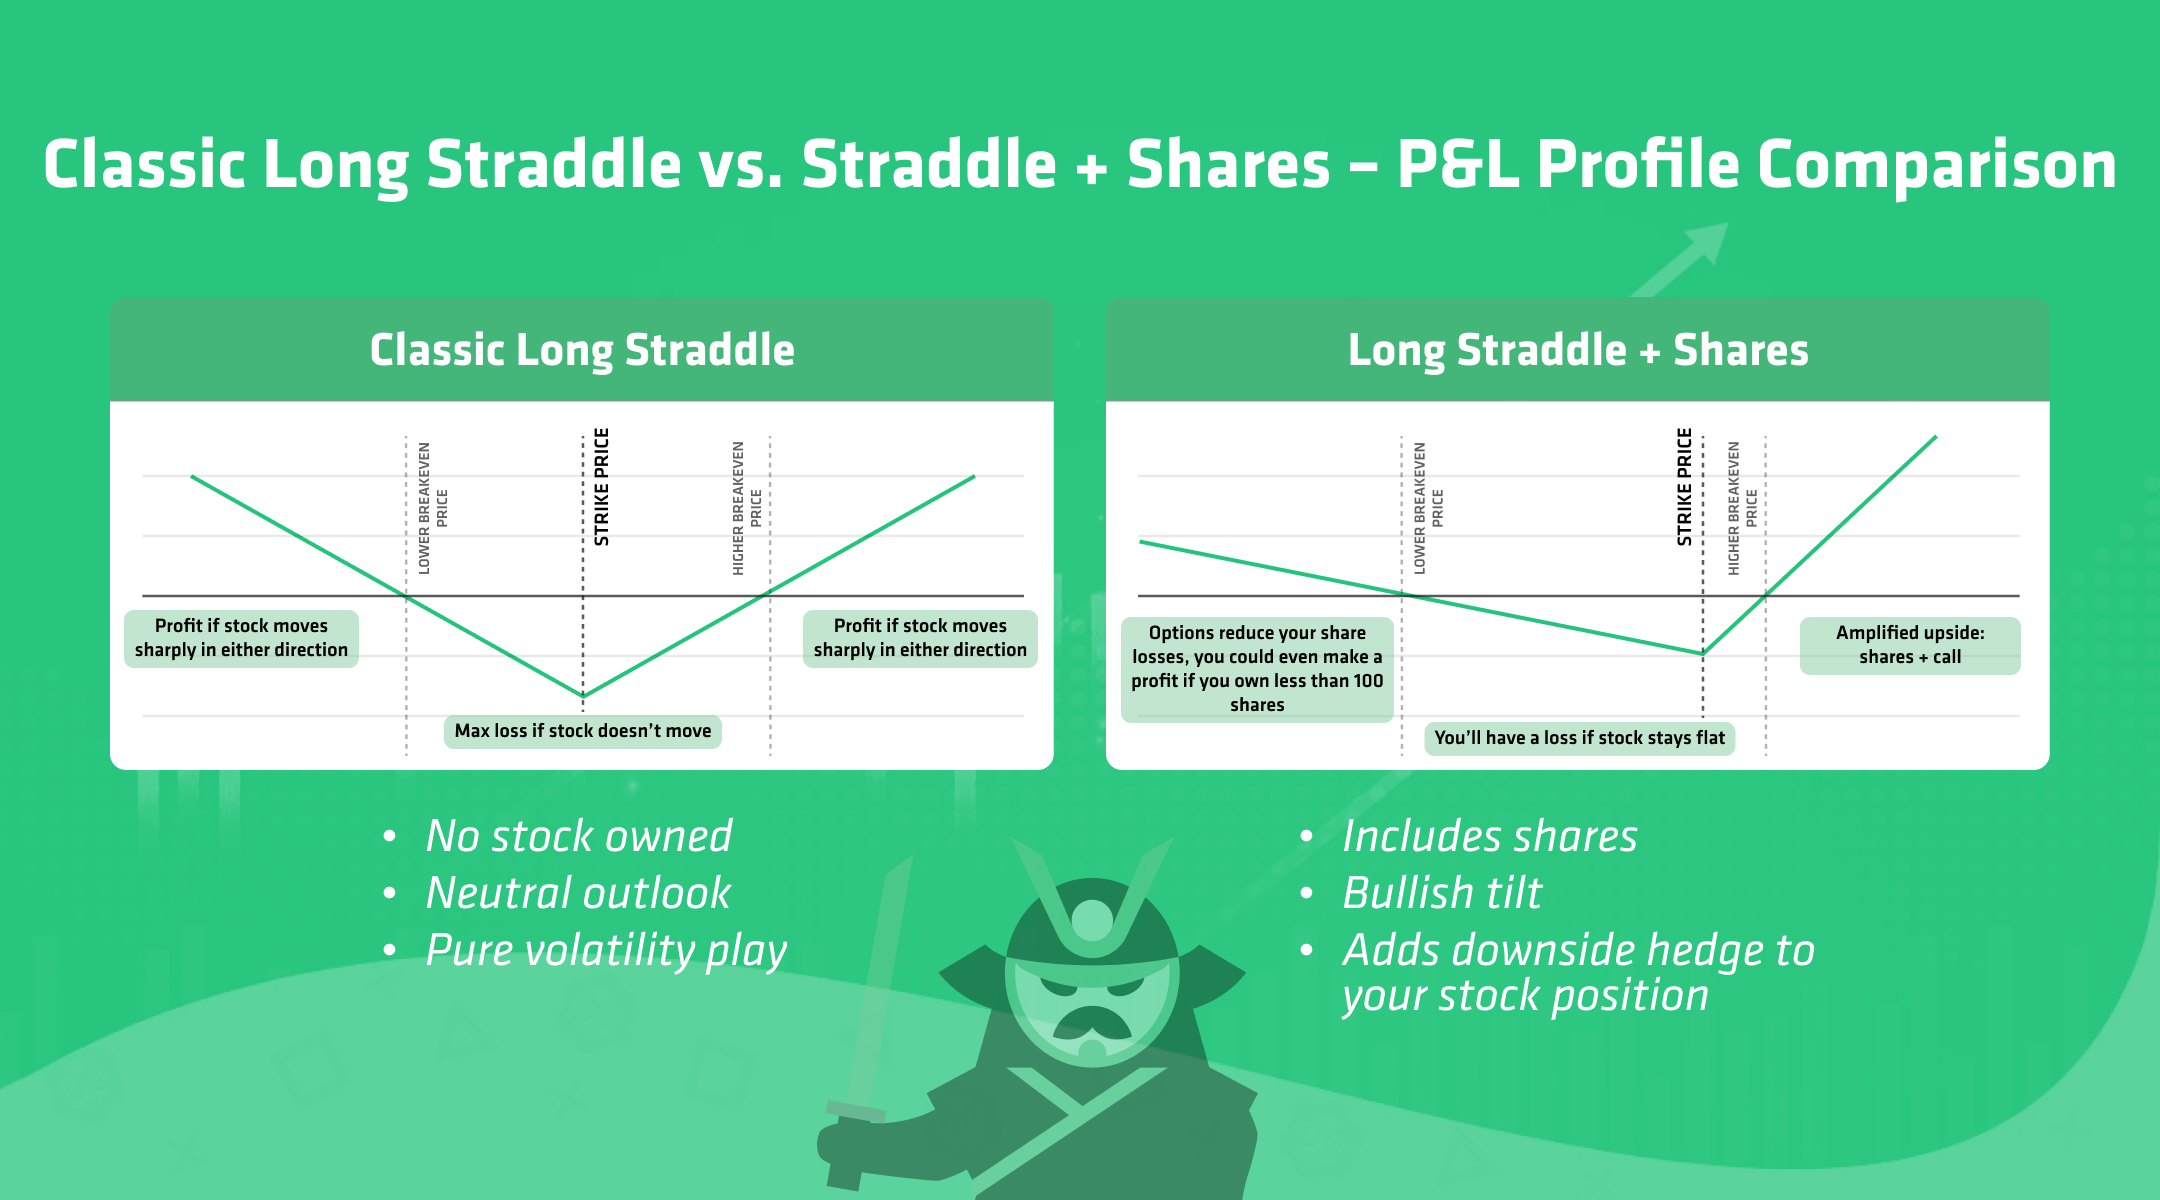
We have summed up the main differences between the 2 strategies in the infographic below:
How to Scan for These Setups
You can build this exact structure in our Custom Strategy Scanner:
- Start a New Scan
- Select “Custom” as the strategy type
- Add three legs:
- 75 shares of stock (or whichever number of shares you own)
- Buy 1 put (ATM or slightly OTM)
- Buy 1 call (same strike as put)
- Adapt your filters. If you already have a stock in mind, start by using the “Include Symbols” filter to narrow the scan to a specific ticker (e.g., AAPL, TSLA, etc.). Otherwise, you can set up a broader scan to surface potential trades by applying the following filters:
- Earnings Date: Select “Before Expiration” to target stocks reporting earnings before the option expires.
- Earnings Date Picker: Choose a custom window (e.g., next week) to catch upcoming events.
- Average Volume: Over 1M, which ensures liquidity.
- Max Loss: You could set it to $500, which would allow you to limit your potential losses. You can edit this amount to a number you are more comfortable with.
- … and more!
Alternatively, we have also created a predefined scan that you can find at the bottom of this article.
How Share Quantity Affects the Straddle Strategy
Pairing a long straddle with stock ownership gives you flexible exposure around key events like earnings. As you increase the number of shares, the trade becomes more bullish and less protective. Here's how the structure behaves across different share counts:
Setup | Downside Risk | Lower Breakeven | Upper Breakeven |
50 shares + straddle | Capped at the strike price | Far | Farthest |
75 shares + straddle | Capped at the strike price, lower compared to the 50-share case | Farthest | Closer compared to the 50-share case |
100 shares + straddle | Capped at the strike price, lower compared to the 75-share case | N/A (you won’t make money if the underlying price declines) | Closer compared to the 75-share case |
125 shares + straddle | Uncapped (losses grow slowly below the strike) | N/A (you won’t make money if the underlying price declines) | Closer compared to the 100-share case |
150 shares + straddle | Uncapped (losses grow faster below the strike) | N/A (you won’t make money if the underlying price declines) | Closer compared to the 150-share case |
In general, keep in mind that:
- The higher the number of shares you own, the lower your loss at the strike price of the long straddle
- Notice how, with less than 100 shares, you can still make money with a price decline (the higher the number of shares, the lower your profit likelihood in a bearish market case)
- Increasing the number of shares shifts the strategy from balanced to bullish-leaning. This means you will be worse off if the underlying price declines
Think of it this way: the more shares you add to a classic long straddle, the more the P&L “V” shape rotates counterclockwise. As your share count increases, the upper breakeven moves closer to the current price, while the lower breakeven moves farther away, or disappears entirely once downside protection is gone (which is what will occur above 100 shares).
Try It Now in the Scanner
Whether you’re holding long-term positions or looking to trade earnings tactically, this structure gives you the best of both worlds: ownership with optionality.
Build your own share + straddle scan today using our Custom Strategy Scanner, and surface setups with the highest volatility potential.
Read More
- Our predefined scan: Earnings Play on Stocks You Own – Straddle + Stocks
- Our options strategy guide: Long Straddle Strategy Explained
- Trading earnings events: The Top Earnings Option Strategies
- Our guide on the custom scan feature: Custom Option Strategy Screener Guide
- Try it yourself in our options screening app
AUTHOR
 Gianluca LonginottiFinance Writer - Traders Education
Gianluca Longinotti is an experienced trader, advisor, and financial analyst with over a decade of professional experience in the banking sector, trading, and investment services.
REVIEWER
 Leav GravesCEO
Leav Graves is the founder and CEO of Option Samurai and a licensed investment professional with over 19 years of trading experience, including working professionally through the 2008 financial crisis.