The edge behind Market Sentiment – Part 2
Published on January 13, 2015(Last updated on October 27, 2025)
By Leav Graves
Please note that the Market Sentiment gadget described below was part of an earlier version of Option Samurai and is no longer available on the platform. We’ve kept this article online for historical reference. As of now, we recommend using the Stock Score as a powerful alternative for understanding overall market direction.
This is the second part in the series about the edge of the market sentiment. Press here to read the first part about relative strength edge.
As we talked about in the last part, the market sentiment edge derives from the combination of quantitative systems that have different mechanisms, together the whole is greater than the sum of its parts.
In this part I wish to describe a simple mechanism for Trend following - Moving Average.
Moving average quantitative edge
A moving average is an average that calculated continuously for the last N occurrences, each new points removes the oldest point. The moving average serves as an adjustable "noise" filter and has many variations that try to make it more adaptable to real moves while still ignore the market noise. The edge of the moving average is well known and many conducted tests about it and some described how to use it in a trading system( Meb Faber blog and Ivy portfolio). You can also use this site and backtest different parameters on ETFs - etfreplay. While I don't think you should use this indicator as-is in a system, you can enjoy the characteristics of this mechanism.
Moving Average edge
To conduct the backtest we took the last 1000 trading days and checked the effect of the moving averages have on 3 top ETFs (SPY, QQQ, IWM). The results are below:
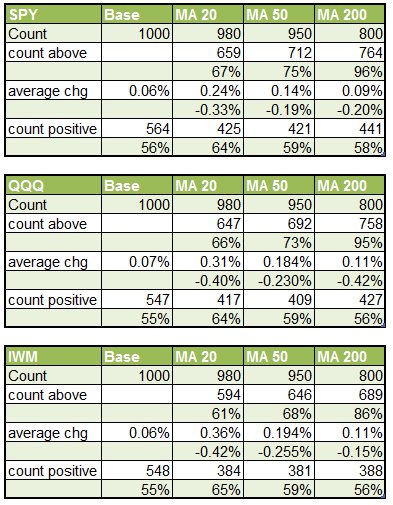
*MA is Moving Average and the number says how many days (MA 200 is moving average 200 days).
As you can see, for each ETF and each time frame, when the market is above the MA we see a bullish tendency - both in size of moves and number of up days.
We can see similar tendency (bullish above MA) in stocks as well. We checked 20 of the most option-liquid stocks and results were identical. If needed, comment and we will send you the results.
summary
To conclude, The Moving average is a trend indicator that helps us determine the bullish tendency of the market - when last price is above the average. The same goes for the opposite: when market is below its average - the trend and tendency is bearish.
We don't recommend to use this as-is in a system as it gives many false signals. However, using it in conjunction with other indicators might prove more profitable.
Sign up for a free trial of OptionSamurai
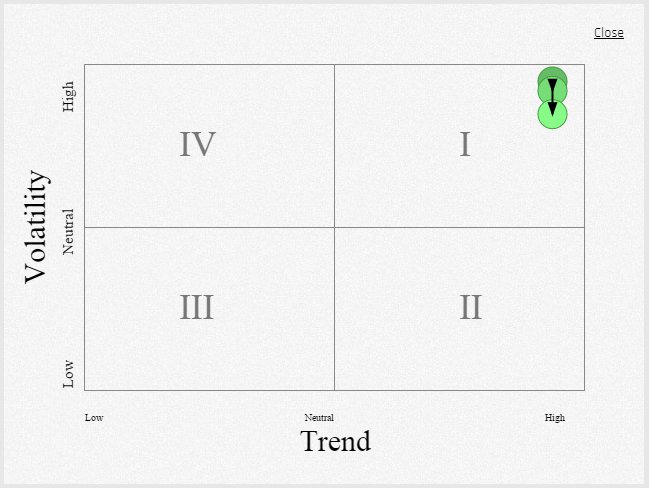
How to open the market sentiment
AUTHOR
 Leav GravesCEO
Leav Graves is the founder and CEO of Option Samurai and a licensed investment professional with over 19 years of trading experience, including working professionally through the 2008 financial crisis.