How to Read an Option Chain? All You Should Know about Option Chains [Option Chain Explained]
Published on August 3, 2025 | 8 min readReviewed by Leav Graves
Options charts may look complex at first, but learning how to read them can give you a real edge. From calls and puts to strike prices and expiration dates, each column tells a story. This guide will walk you through how to read options charts with clarity and confidence.
KEY TAKEAWAYS
- An option chain shows two types of contracts: calls and puts. A call lets you buy a stock, and a put lets you sell it.
- Each option has a strike price and a premium. The strike is the stock price you're betting on, and the premium is the cost to make that bet.
- Option chains also list expiration dates. The closer the expiry, the less time you have for your trade to work, and that affects how much the option costs.
How to Read an Option Chain?
If you are wondering how to read an option chain, start from the basics. An option chain shows two types of contracts: calls, which give you the right to buy a stock, and puts, which give you the right to sell it. You’ll usually see them side by side, split around a list of strike prices.
You can find option chains on most broker platforms, as well as free tools like Yahoo Finance or Nasdaq. Just search for a stock and click the “options” tab. In fact, here is how an option chain will normally look like - a real-world example with the option chain explained clearly.
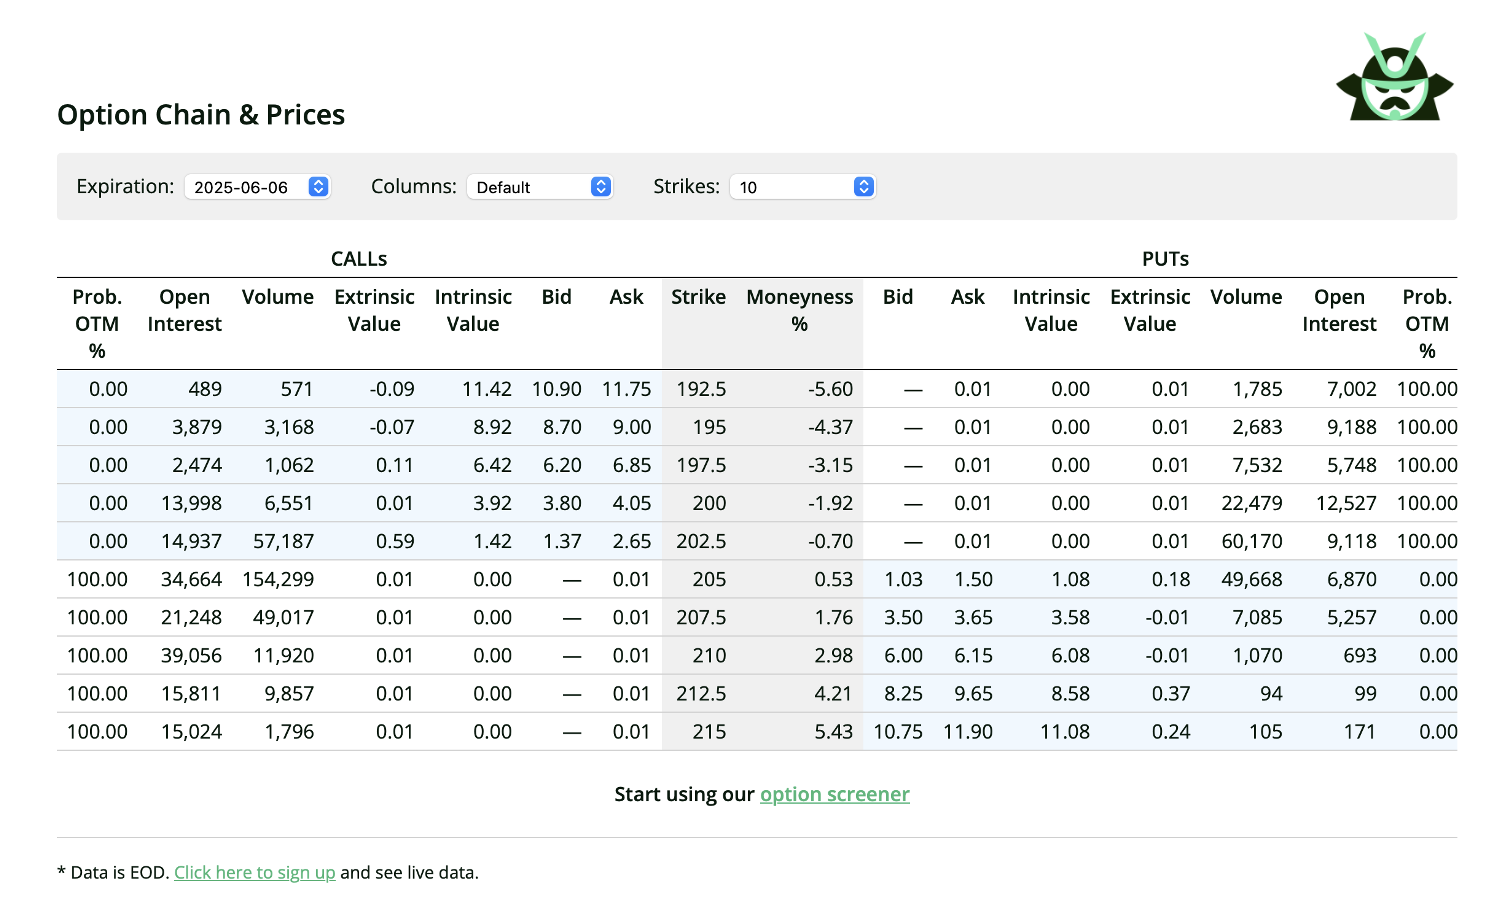
Let us read the chart above. We’ll start from the basics and we will gradually comment on each element. First of all, option chain shows:
- Calls on the left, puts on the right
- A center column with strike prices
- Several other data points on which we will comment in the sections below.
If you’re learning how to read an option chain, this layout helps you quickly spot where the stock is trading and how close each option is to the money.
Once you get the basic layout, the next step is learning how to read options pricing and expiration details.
This is the first step in learning how to read options charts and how to read charts for options trading.
Option Chain Explained: Calls vs Puts
A call option gives you the right to buy 100 shares of a stock at a certain price before a set date. A put option gives you the right to sell 100 shares under the same kind of terms. Calls are for traders who expect the stock to go up. Puts are for those who expect it to go down.
When learning how to read an option chain, this split matters. Every option chain is organized with calls on one side and puts on the other. In between, you’ll see strike prices - these help you compare which contracts are closer to the current stock price.
If you’re wondering how to read options or how to read options chart data fast, this layout helps a lot. It’s also a great first step for how to read charts for options trading.
Understanding Expiration Dates
Every option has an expiration date. On most platforms, option chains are grouped by these dates - you’ll usually see them listed at the top of the screen. Clicking one opens up all the available contracts for that expiry.
Shorter-term options, like weekly contracts, are cheaper but lose value fast. That’s due to time decay - the closer you get to the expiration date, the faster the option's price drops if the stock doesn’t move in your favor.
Longer-term options give the trade more time to work, so they cost more upfront but decay slower. These include:
- Weekly options - expire in days, often used for quick trades
- Monthly options - standard for most traders
- LEAPS (Long-Term Equity Anticipation Securities) - can last up to two years or more
Understanding how expiration affects value is key if you want to learn how to read options, how to read options chart data, or how to read charts for options trading. It’s part of mastering how to read an option chain, and a key part of getting the full option chain explained in a way that makes sense to real traders.
If you're exploring shorter-term strategies, this guide on weekly options trading breaks down how to use quick expiration cycles for targeted trades.
Strike Price: The Key Reference Point
The strike price is the fixed price at which you can buy (with a call) or sell (with a put) the stock. In most platforms, strike prices are listed in the center of the option chain, between calls and puts.
Traders choose strike prices based on how much movement they expect and how much risk they’re comfortable with. Lower-priced options are usually further out of the money but carry higher risk.
The strike price also helps define your break-even point. Understanding this is a key step in how to read an option chain, and it’s where you start to see the full option chain explained with real clarity.
In-the-Money vs Out-of-the-Money Options
When learning how to read an option chain, one key concept is understanding whether an option is in the money (ITM), at the money (ATM), or out of the money (OTM). This helps you gauge the option’s value and how far it is from being profitable.
Call Options
- In the money: The stock price is above the strike price
- At the money: The stock price is equal to the strike price
- Out of the money: The stock price is below the strike price
Put Options
- In the money: The stock price is below the strike price
- At the money: The stock price is equal to the strike price
- Out of the money: The stock price is above the strike price
ITM options already have intrinsic value. For example, if a stock is trading at $42 and you hold a $40 call, your option has $2 of built-in value. But that doesn’t mean it’s automatically profitable - you still need to account for the premium you paid. If that $40 call cost $3, you'd still be at a $1 loss until the stock hits $43.
OTM options are cheaper but riskier. If the stock doesn’t move enough, they’ll expire worthless. That’s why knowing how to read charts for options trading and how to read options chart data alongside the chain itself is so important.
The Option Premium and Market Pricing
The premium is the price you pay to buy an option. It changes all the time based on three factors: intrinsic value (how much the option is in the money), time value (how far until expiration), and implied volatility (how much the stock might move).
When learning how to read an option chain, pay close attention to three pricing terms:
- Bid - what buyers are offering right now
- Ask - what sellers want to get for the option
The bid-ask spread tells you about liquidity. A tight spread (like $1.00 bid and $1.05 ask) means it's easy to get in or out. A wide spread (like $1.00 bid and $1.50 ask) means less volume and higher cost.
This is where many traders get tripped up when figuring out how to read options chart data or how to read charts for options trading. Every cent counts.
Volume and Open Interest
Volume and open interest are two numbers that help you size up activity in an option. They’re easy to spot once you know how to read an option chain.
- Volume shows how many contracts were traded today
- Open interest shows how many contracts are still open from earlier trades
High open interest usually means better liquidity. That’s a good thing - it’s easier to get in and out of a position, and the bid-ask spread tends to be tighter. For example, an option with 10,000 contracts of open interest will usually trade more smoothly than one with 15.
But don’t confuse open interest with market direction. A high number doesn’t mean traders are bullish or bearish. It just means there are lots of active positions.
If you’re learning how to read options, how to read options chart info, or how to read charts for options trading, volume and open interest will help you spot which contracts are worth your attention.
Other Fields you Should Know to Understand How to Read an Option Chain
Some platforms add extra columns to the chain. If you're learning how to read an option chain, don't ignore these - they can be useful.
One example is “Prob. OTM %” (you may have spotted this in our image at the top of the article), which is the probability that the option will expire out of the money. It’s not a guess or a forecast. It comes from the same formulas used to price options and is based on current implied volatility. Most brokers show this number before you place a trade, and it's available in our options screener too - another way to get the option chain explained beyond just price and volume
Implied volatility (IV) plays a big role here. It reflects how much the market expects the stock to move. Higher IV means higher premiums. Big news like earnings reports can cause IV to spike, even if the stock hasn’t moved yet.
You might also see Greeks listed:
- Vega shows how sensitive the price is to changes in IV
- Others include Delta and Theta, but Vega is most relevant here
To better understand what IV and Greeks are, we are adding a couple of links at the bottom of this article.
All of this adds extra context when you’re figuring out how to read options, how to read options chart info, or how to read charts for options trading with more confidence.
How to Read an Option Chain? Tips for Beginners and More Experienced Traders
Reading an option chain is not the same for everyone. Beginners should focus on keeping things simple and managing risk. More advanced traders can start analyzing volatility and the Greeks. Here’s a quick summary to guide both - another way to keep the full option chain explained in a format that fits your trading level.
Tip Type | How to Read an Options Chain? What to Focus On |
Beginner | Stick to clear setups, understand calls and puts, and risk no more than 1-2% of your capital |
Advanced | Use delta to estimate probabilities, scan for high IV, and define exit strategies |
Whether you're just learning how to read an option chain or you're refining how to read charts for options trading, having a game plan matters. Look for trades that fit your risk level, and don’t forget to check expiration, strike, and premium together.
And no matter your level, reviewing common option trading mistakes can help you avoid painful errors that derail otherwise solid trades.
Read More - How to Read an Options Chain
AUTHOR
 Gianluca LonginottiFinance Writer - Traders Education
Gianluca Longinotti is an experienced trader, advisor, and financial analyst with over a decade of professional experience in the banking sector, trading, and investment services.
REVIEWER
 Leav GravesCEO
Leav Graves is the founder and CEO of Option Samurai and a licensed investment professional with over 19 years of trading experience, including working professionally through the 2008 financial crisis.