Long Straddle Breakout Strategy: Using Low IV and Bollinger Bands to Spot Setups
Published on September 4, 2025Reviewed by Leav Graves
A long straddle gives traders a way to bet on a breakout without picking a direction. But when is it worth the cost? This article looks at why low implied volatility, Bollinger Bands squeezes, and volume signals can create the right setup for this strategy.
KEY TAKEAWAYS
- A long straddle is a very good strategy to profit from a price breakout in the underlying asset, since it benefits from big moves in either direction.
- Traders use this strategy when implied volatility is low and a volatility spike is likely, often around events or technical setups.
- Using scans that combine Bollinger Bands, low IV rank, and volume filters helps identify the best opportunities to execute this strategy.
What is a long straddle?
A long straddle is built by buying one at-the-money call and one at-the-money put with the same expiration. Both options cover the same strike, so the trade has no directional bias. The goal is simple: profit if the stock makes a big breakout move, up or down.
This setup works because the combined position creates unlimited upside if the stock rallies and strong downside coverage if it falls. In fact, here is the typical P&L of this strategy:
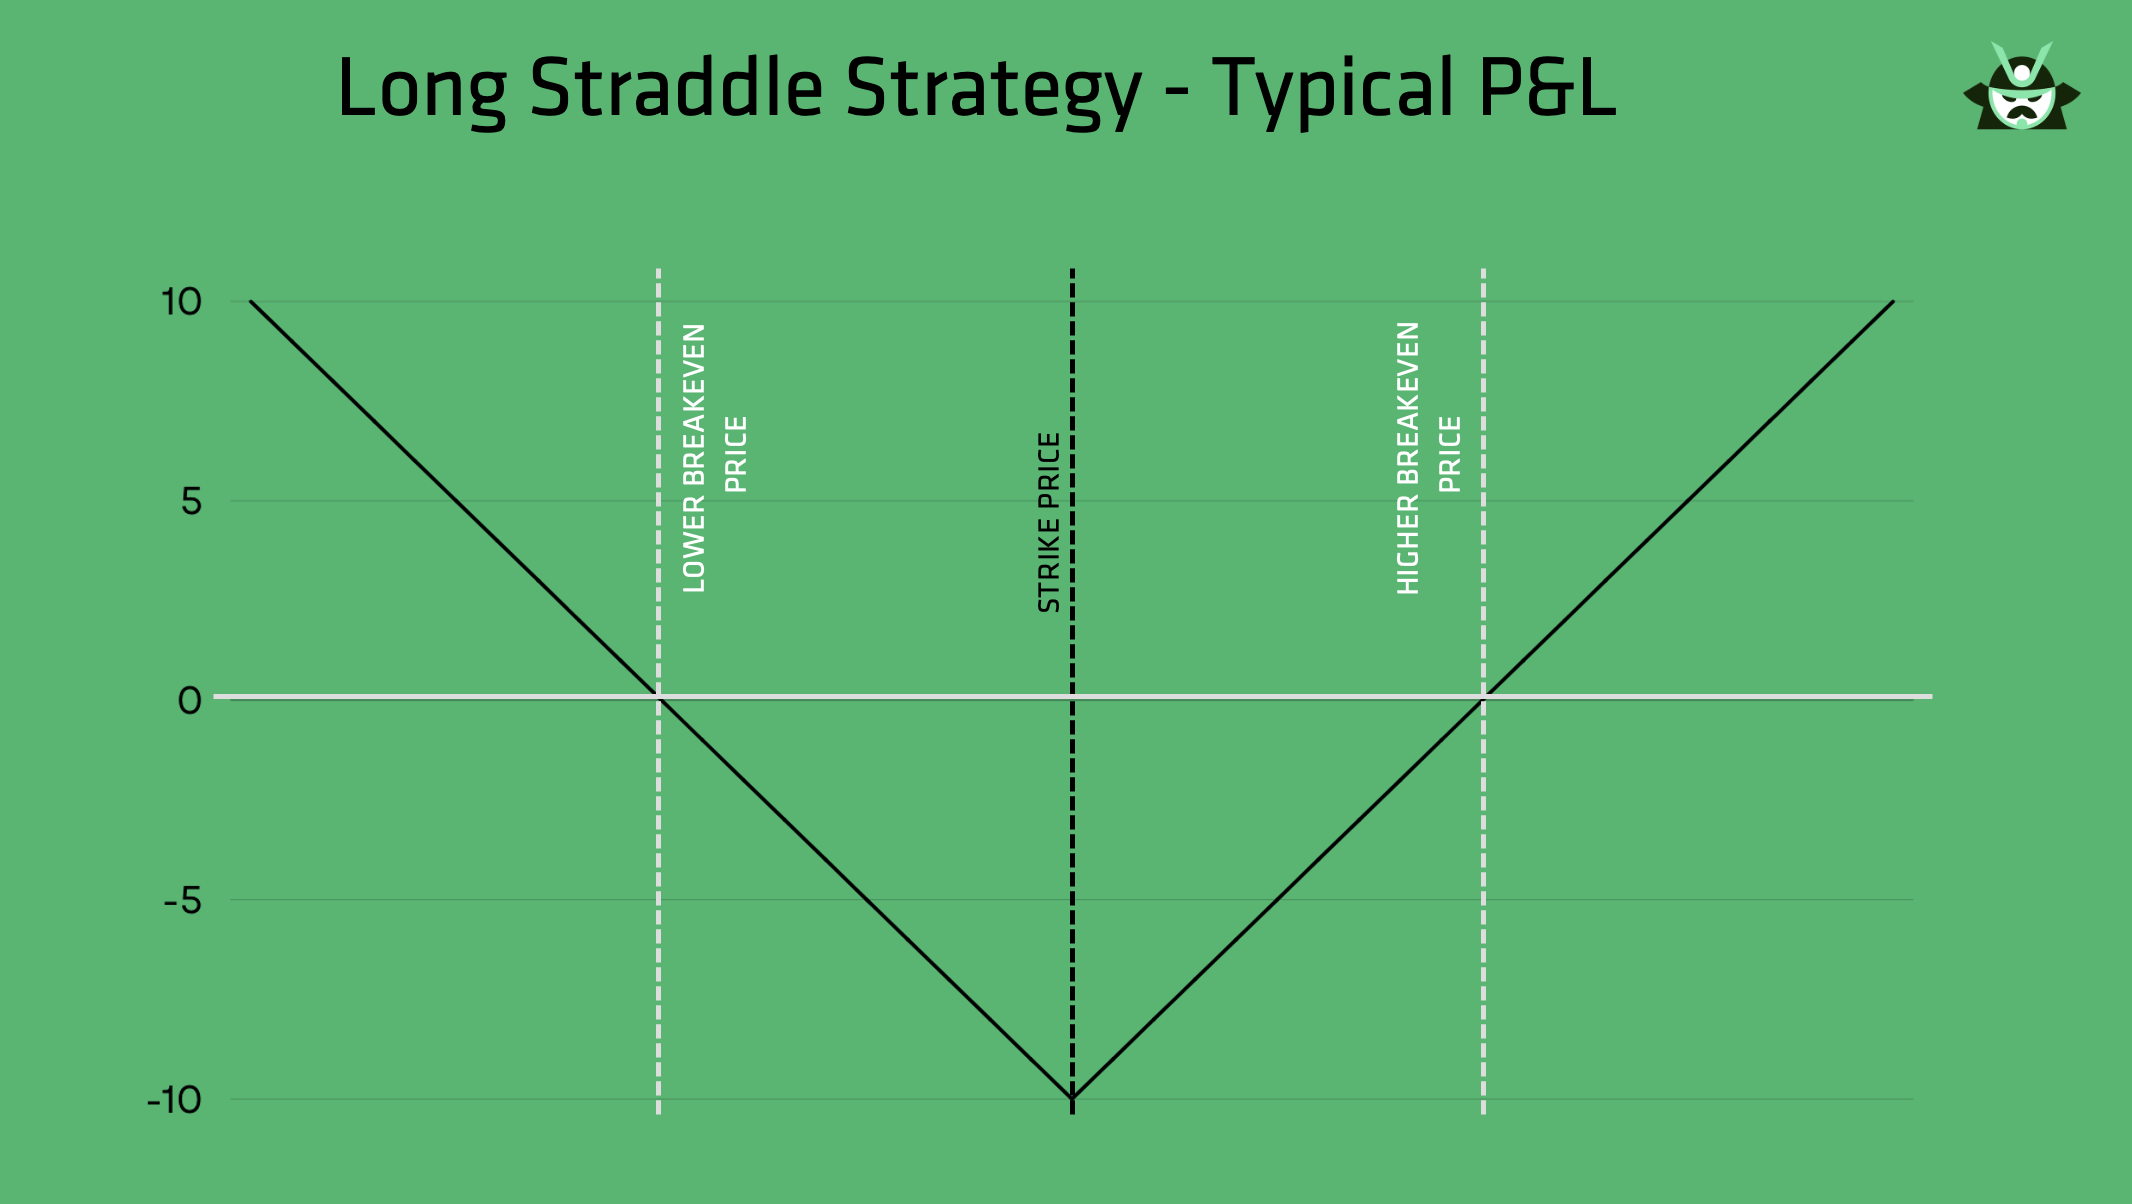
As you can see, the only real risk occurs if the stock price closes exactly at the strike level of the options you bought. Your maximum loss will be the total premium paid. What’s the appeal of this strategy? Simply put, for many traders, it is easier to open this type of trade than trying to predict the exact direction.
Volatility plays a big role. When implied volatility is low, the cost of entering a long straddle is cheaper. If volatility later rises, both options gain value even before the breakout occurs.
Here are some key points to remember (they will be important to understand the predefined scan we designed):
- Entry cost is highest risk, profits grow with movement
- Breakouts drive returns, not small swings
- Low IV improves the edge
Why you should look for breakout setups with a long straddle
If you are following our reasoning, you should begin to understand that finding a stock with a high chance of breaking out (either up or down) is what gives the long straddle its edge. The whole strategy relies on catching a strong move that offsets the cost of both options.
Traders often look for consolidations, where the stock trades in a tight range for several days. This quiet phase can set up the conditions for a sudden shift once buyers or sellers take control. A common way to spot this is with Bollinger Bands, which normally look like this:
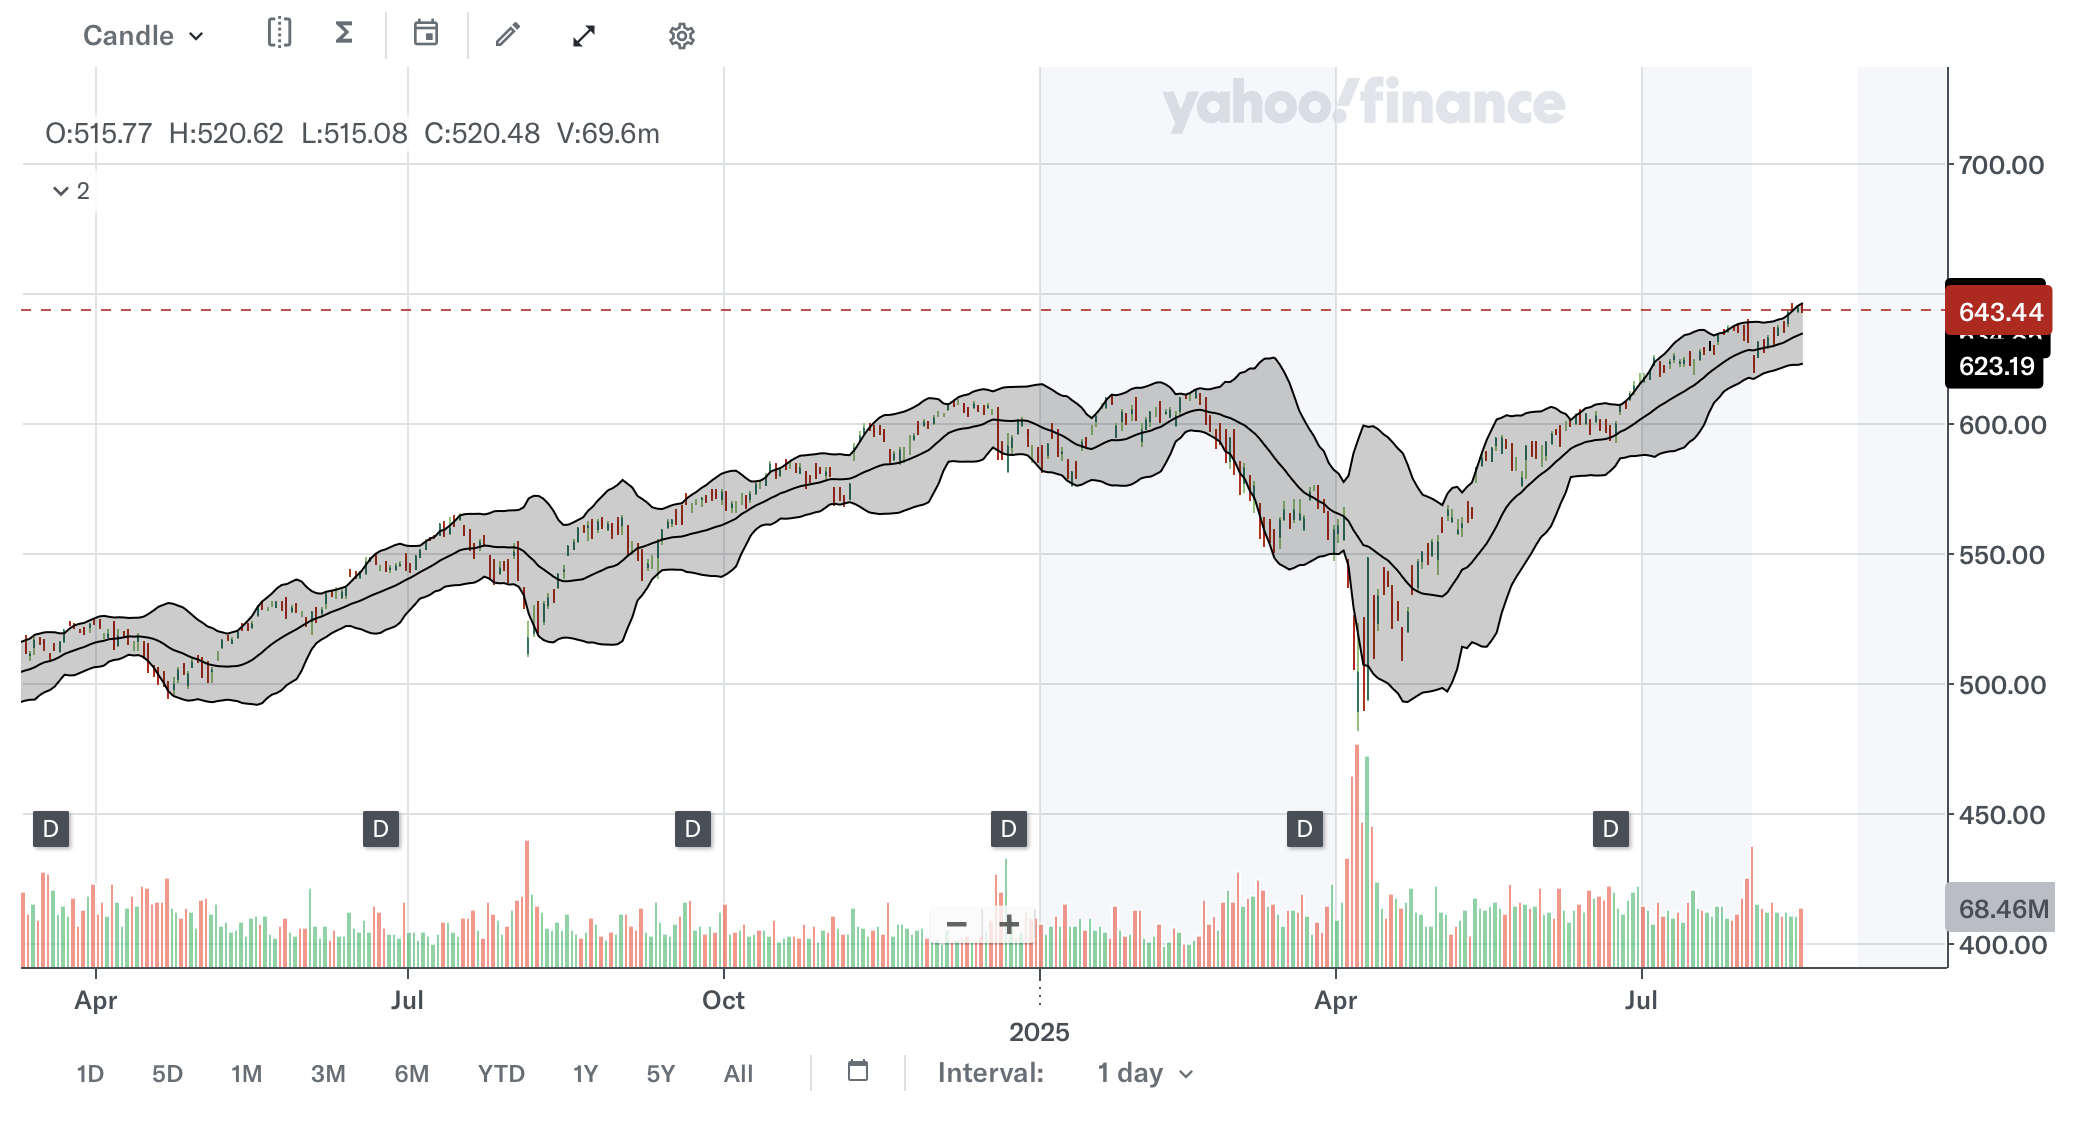
The chart above is the daily price of SPY with the application of the Bollinger Bands indicator. As you can see, there are mainly 2 phases:
- Calm phases: the market moves sideways, and the distance between the 2 bands tends to become smaller
- Breakout phases: the market explodes either up or down, hitting or even going beyond one of the 2 bands.
When the bands contract and stay narrow, it signals that volatility has dried up. History shows that these contractions are usually followed by a surge in price movement.
The long straddle fits perfectly in this setup because:
- The trade does not require guessing direction
- A breakout to either side can bring quick profits
- Low implied volatility during the squeeze makes entry cheaper
In short, periods of calm often lead to explosive moves. By pairing a long straddle with Bollinger Band signals, traders position themselves to capture profit when the market shifts out of balance.
The role of implied volatility in long straddles
There's a very important aspect to consider when trading a long straddle, and that is implied volatility. Implied volatility (IV) reflects the market’s expectation of how much the stock will move in the future. The higher the IV, the more expensive the options become.
For a trader, this means timing matters. Entering a long straddle when IV is already high makes the trade costly, and you need an even bigger breakout to win. But when IV is low, the same setup is much cheaper, and the odds improve if volatility expands later.
That’s where IV rank and IV percentile come in. They measure today’s IV against its past range. A low rank means options are relatively cheap compared to recent history. This is where the strategy finds its edge.
So, you should keep in mind that:
- Low IV makes the entry more affordable
- Rising IV after entry boosts both legs of the straddle (vega exposure)
- Pairing low IV with breakout setups gives the best chance of success
In practice, this means the long straddle is not only about directionless trading, but also about buying volatility when the market is complacent.
Using scans to find the best long straddle opportunities
A systematic scan removes guesswork and makes it easier to spot the right setups. The scan we use on our screener for options traders is called Long Straddle Breakouts on Low IV Compression Plays. The scan looks for stocks where conditions align for a potential volatility surge. You can refer to the “Read More” section at the bottom of this article to find the link to this predefined scan.
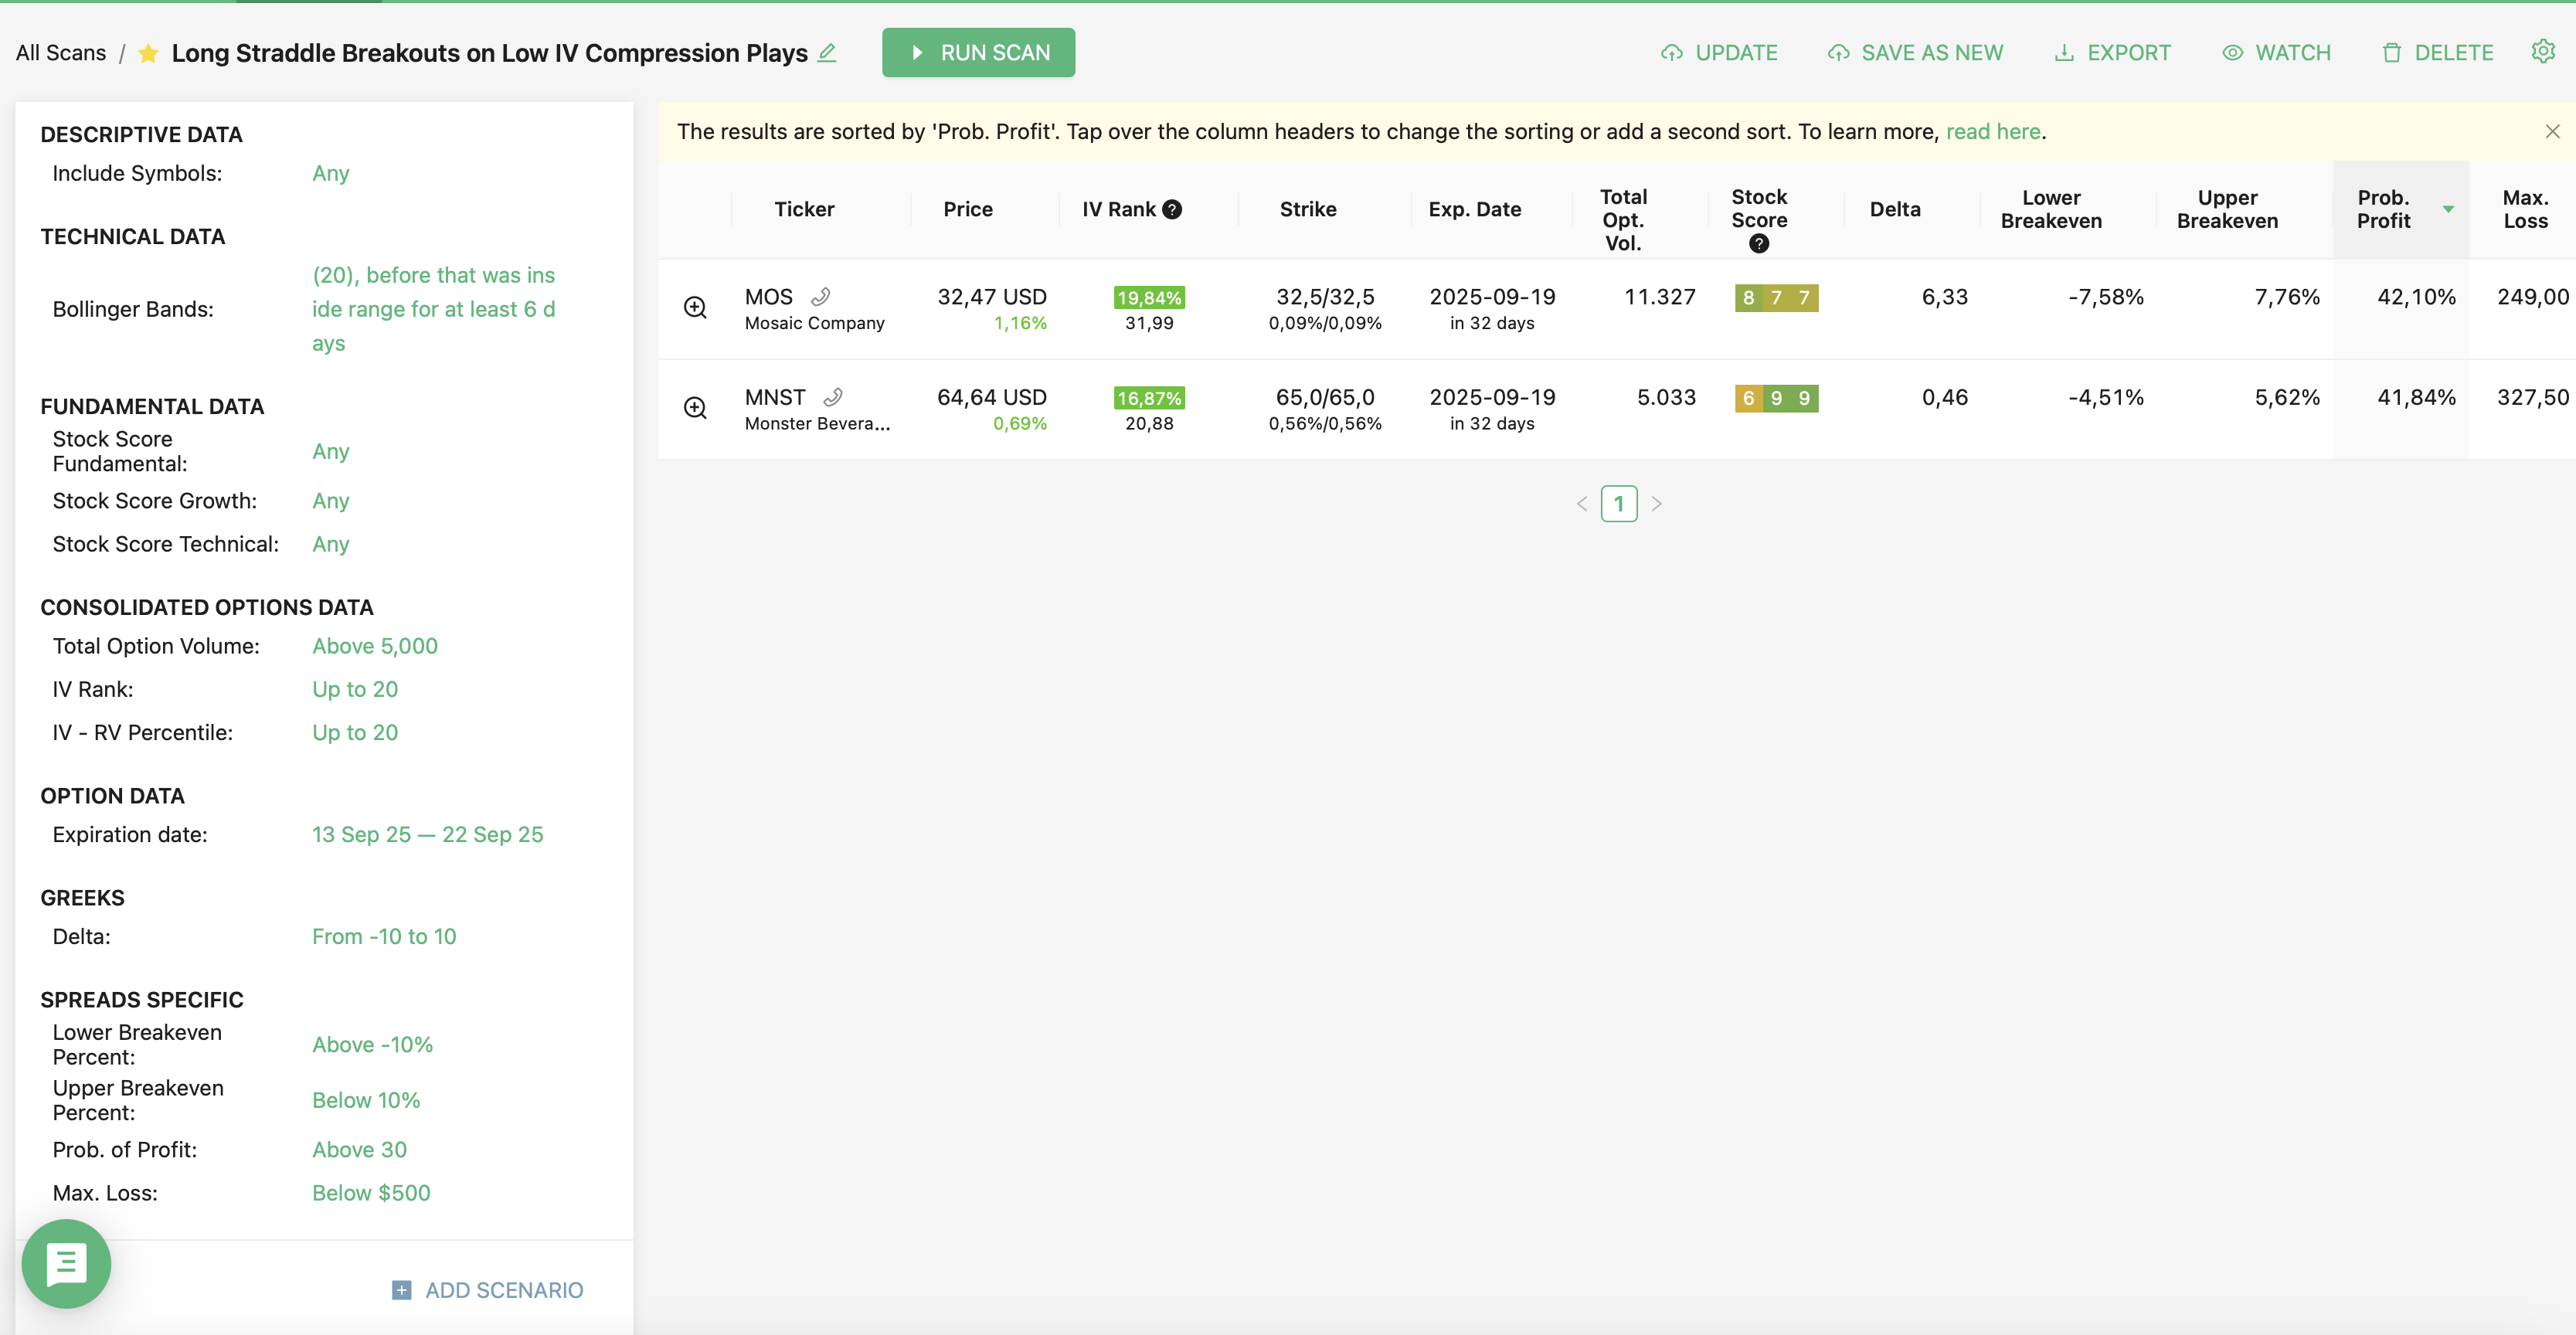
The first filter is Bollinger Bands. When the bands contract tightly for several days, the stock is signaling low volatility. Historically, this kind of squeeze is often followed by a breakout. A long straddle benefits here because the trade does not rely on direction, only on the size of the move.
Option data adds another layer of quality control. High option volume (above 5,000 contracts) confirms liquidity, making it easier to enter and exit at fair prices. Low IV rank below 20% means the options are cheap compared to recent history. And because a movement in IV tends to anticipate a move in the realized volatility (RV) of the underlying stock (which is what you are aiming for), we look for those cases in which not only IV is low, but it is higher than RV (in percentile terms). That lowers risk and sets up the chance for profits if volatility expands.
Expiration matters too. Choosing contracts about 1-2 weeks out captures the likely move while keeping costs lower than longer-dated options.
In short, this scan helps traders avoid random picks and instead focus only on stocks where:
- Volatility has compressed
- Options are attractively priced
- Volume supports execution
- Expiration lines up with the expected move
By combining these factors, the scan highlights the most promising opportunities to trade a long straddle with an actual volatility edge.
Example of a long straddle trade
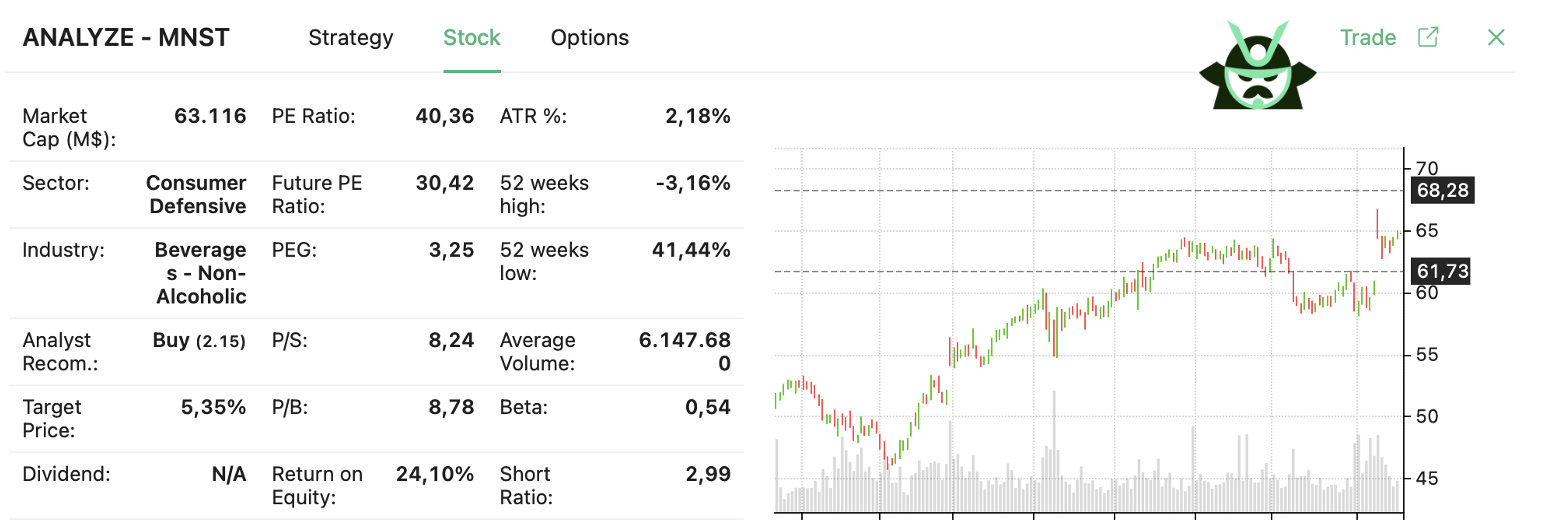
We found a trade thanks to the predefined scan mentioned earlier. The setup is a long straddle on MNST. With MNST trading at $64.64, you could buy a call and a put, both at the $65 strike price, expiring in one month:
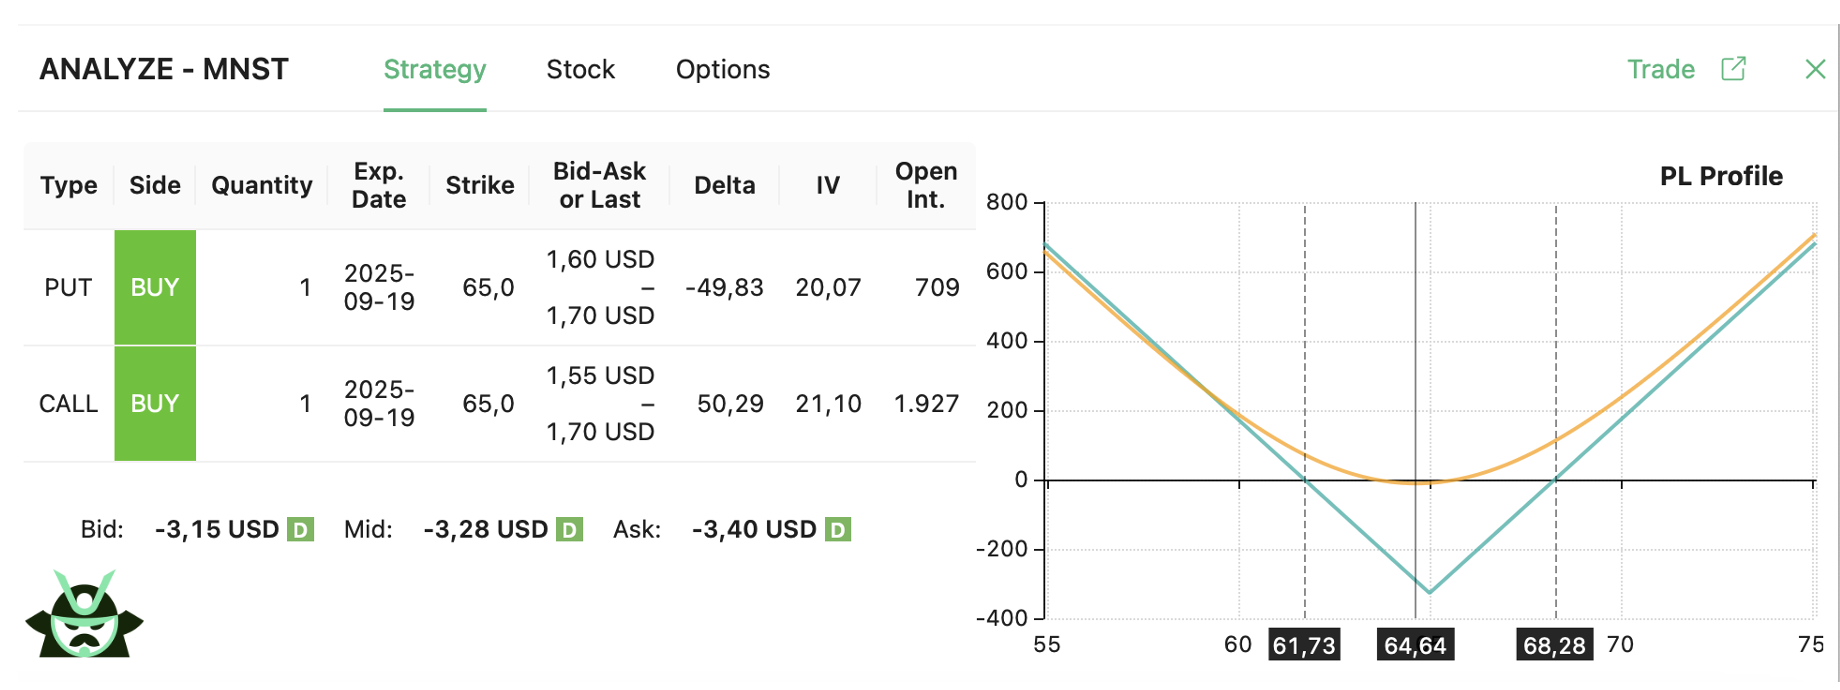
The math is simple, and you can also see this in the chart above: by expiration, MNST has to move either above $68.28 or below $61.73 for the trade to show profit. Anywhere in between results in some degree of loss.
Looking at the price chart, MNST has been stuck near $65 after hovering inside a narrow band for several sessions:
This kind of action is what the scan was built to detect.
Two main reasons made MNST stand out:
- Its implied volatility is very low, with an IV rank at 17%. The IV percentile is more than 20 points higher than the RV percentile, showing options are cheap relative to realized volatility.
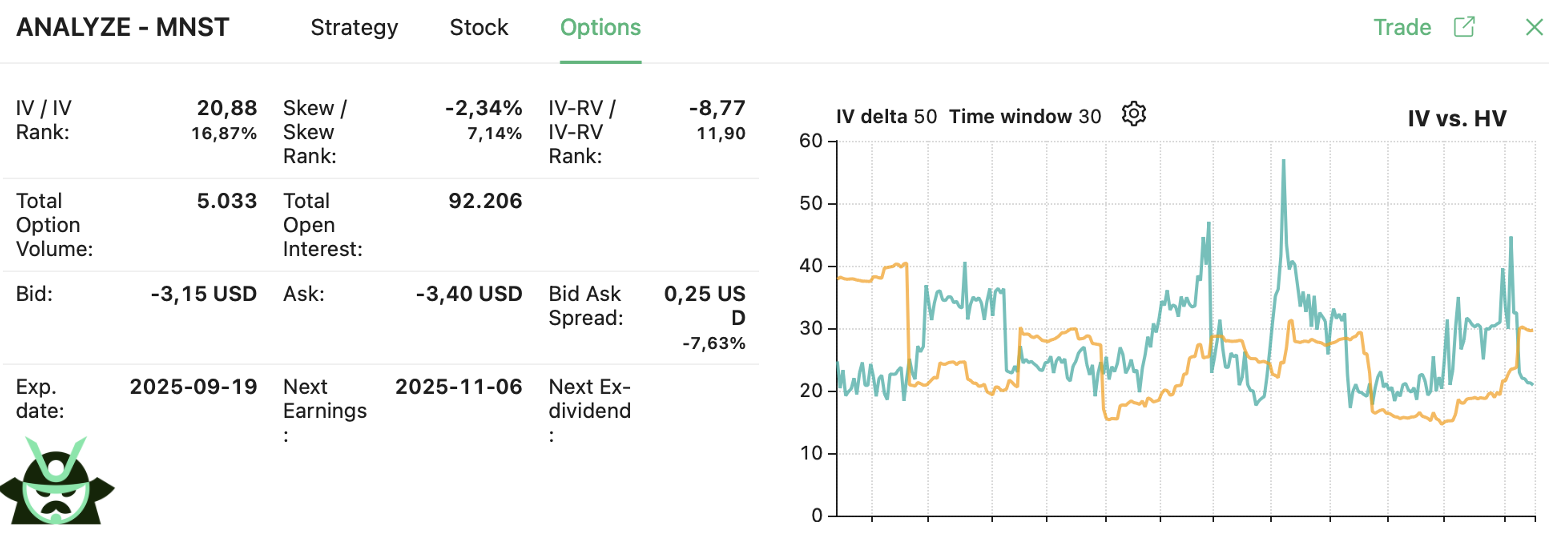
- The stock price stayed inside the Bollinger Band range for more than 6 days, signaling compression and raising the chance of a breakout.
The worst-case scenario is straightforward: if MNST finishes exactly at $65 at expiration, the combined premium of $328 is lost. That is the maximum risk. But if the stock breaks out of the range, upside is unlimited. Of course, you don’t need to wait until expiration. You should probably consider closing this earlier once the breakout or IV expansion delivers a profit, as it is often better to lock in a profit in these cases.
This example shows how a systematic scan not only finds setups, but also ensures the long straddle is entered when the odds of a sharp move are higher and the cost of entry is manageable.
Read More
AUTHOR
 Gianluca LonginottiFinance Writer - Traders Education
Gianluca Longinotti is an experienced trader, advisor, and financial analyst with over a decade of professional experience in the banking sector, trading, and investment services.
REVIEWER
 Leav GravesCEO
Leav Graves is the founder and CEO of Option Samurai and a licensed investment professional with over 19 years of trading experience, including working professionally through the 2008 financial crisis.