Open Interest Report: How Can You Trade It? Here’s What the Backtest Shows
Published on August 28, 2025(Last updated on December 14, 2025)
Table of Contents
- Key Takeaways
- Strategy Comparison Table
- What is Our Open Interest Report and How to Use It
- Strategy #1: RAW open interest report - trading extremes directly
- Strategy #2: open interest report + RSI(14) - filtering with technical extremes
- Strategy #3: open interest report + SPY 50MA - market regime filter
- Strategy #4: open interest report + total OI filter - using institutional weight
- Wrapping It Up
Reviewed by Leav Graves
Table of Contents
- Key Takeaways
- Strategy Comparison Table
- What is Our Open Interest Report and How to Use It
- Strategy #1: RAW open interest report - trading extremes directly
- Strategy #2: open interest report + RSI(14) - filtering with technical extremes
- Strategy #3: open interest report + SPY 50MA - market regime filter
- Strategy #4: open interest report + total OI filter - using institutional weight
- Wrapping It Up
Many traders focus on charts or news, but options positioning tells a different story. We’ve backtested our open interest report to see if it can help predict stock price moves. By testing raw signals, RSI filters, market trends, and total open interest levels, we explore which setups offer the best edge.
KEY TAKEAWAYS
- The open interest report helps spot where options traders are placing their biggest bets.
- Backtesting shows that the open interest report signals can lead to real price moves in the underlying stock.
- You can use the open interest report by itself, or filter it by looking at RSI levels, the overall market trend (SPY), or the total open interest value to focus on higher-conviction setups.
Strategy Comparison Table
We backtested our open interest report over a full year (May 2024 to April 2025) and found something clear: it has an edge. The signals can often predict where price is heading. But there’s a catch.
The problem is that the raw report can be noisy. It generates signals almost every day, across many tickers. That’s hard to trade consistently, especially for retail traders who prefer fewer, higher-quality setups.
The solution? We tested ways to filter the signal and reduce the noise. The goal was simple: fewer trades, better results. Even if we filter out some winners, reducing the noise will generate a greater edge.
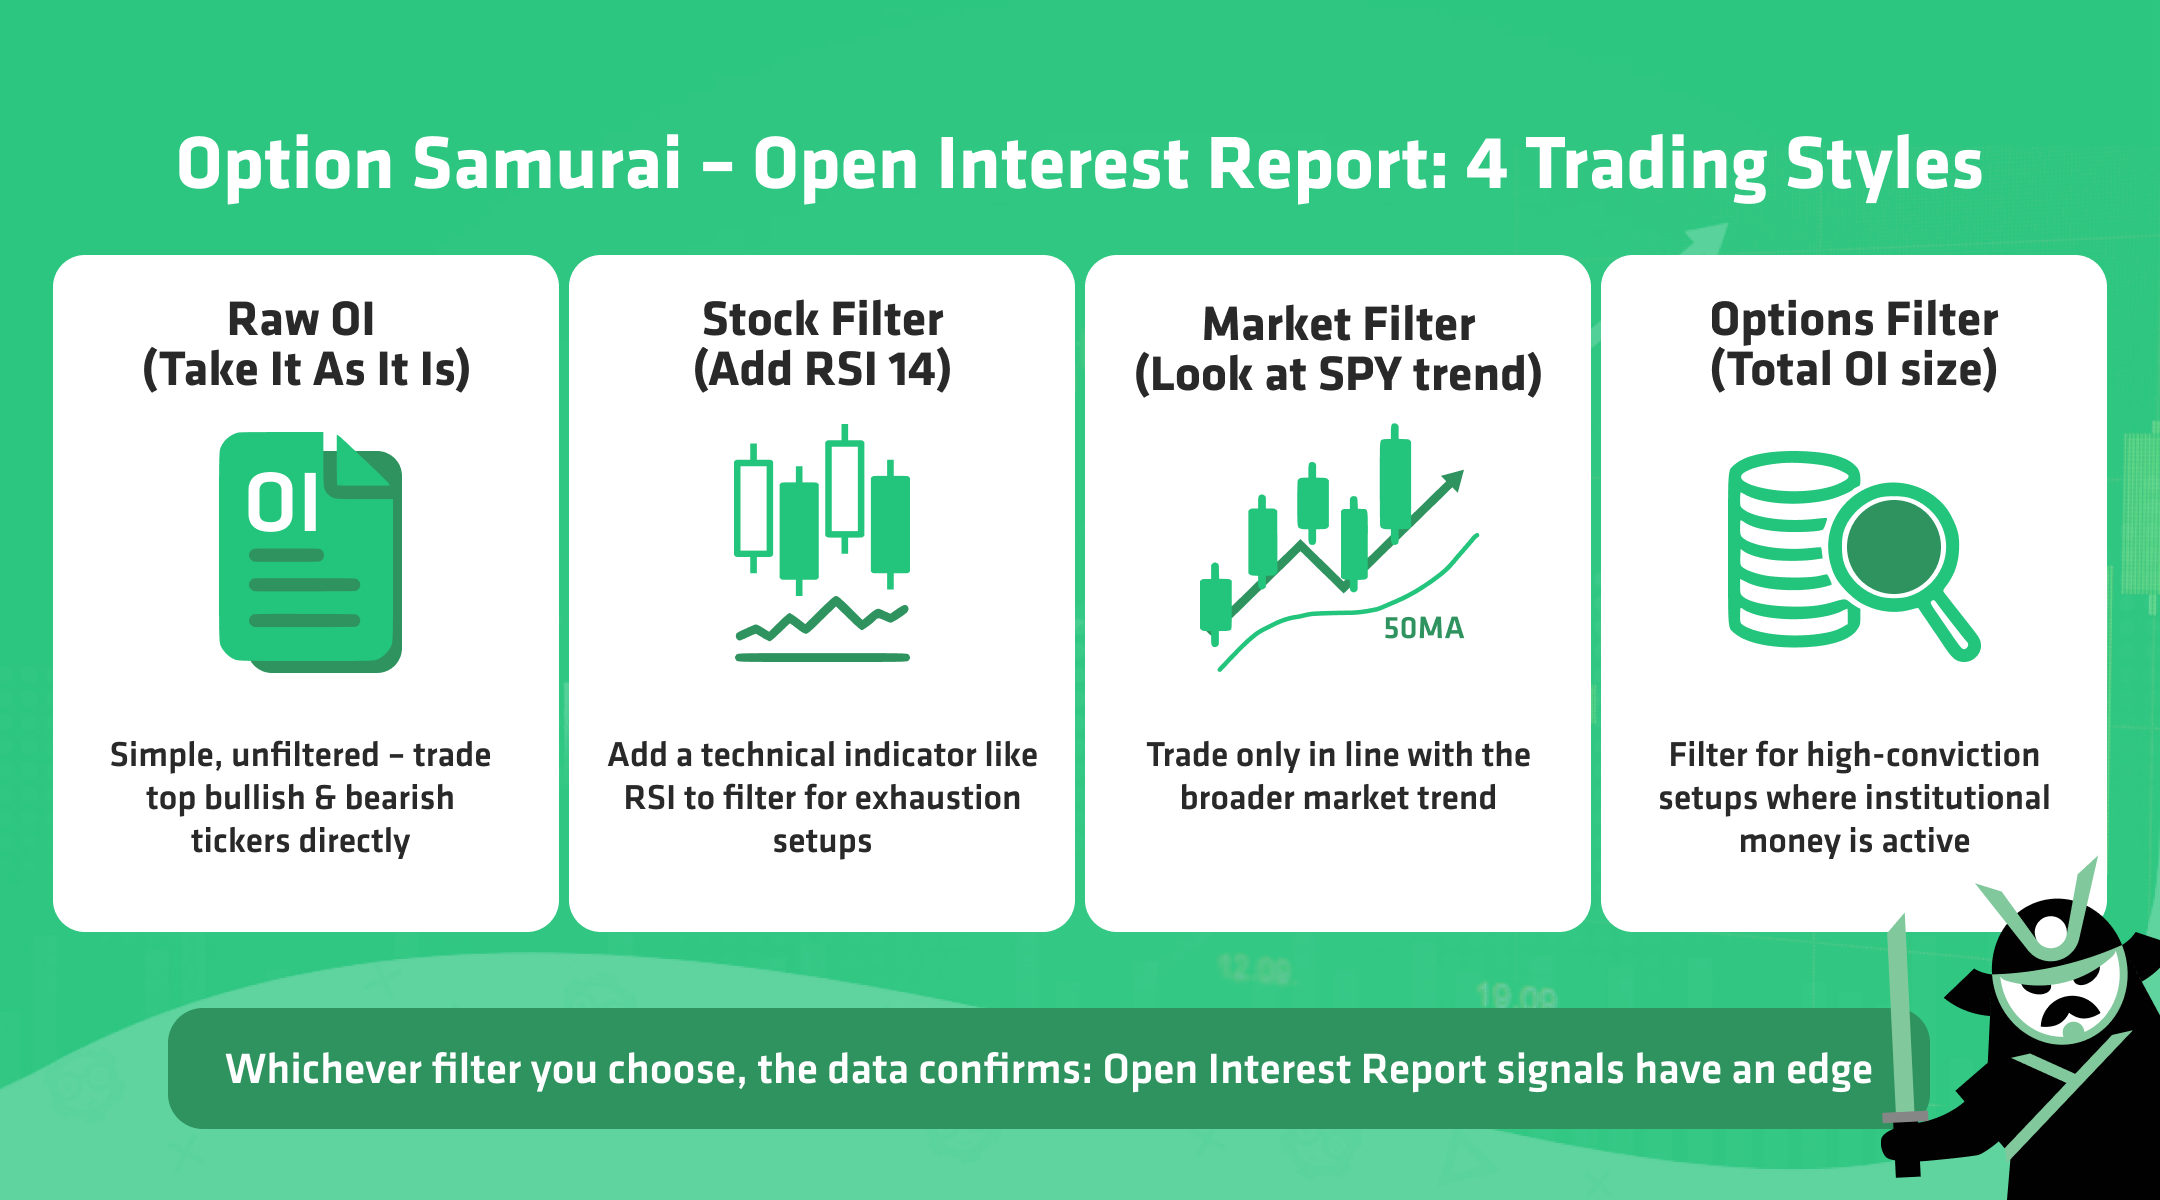
Each filter we used targets a different “lens”:
- Stock behavior – we used RSI(14) to detect exhaustion
- Market trend – we used SPY’s 50-day moving average to define the market trend.
- Institutional conviction – we used a total open interest threshold to focus only on setups with real size behind them
Below is a summary of how each filtered strategy performed compared to the raw signals. You can jump to the one that fits your trading style, or read through all of them for a complete picture.
Strategy | # Trades | Avg Win % | Avg Loss % | Total PnL % | Trading Style |
Raw OI | 215 (Win %: 53%) | 23.28 | -16.81 | 956.07 | Simple, unfiltered |
Stock filter - RSI(14) Filter | 102 (Win %: 58.8%) | 22.95 | -16.94 | 665.49 | Stock-focused |
Market filter - SPY MA Filter | 138 (Win %: 56.5%) | 21.30 | -14.46 | 793.44 | Market-aware |
Options filter - Total OI Filter | 64 (Win %: 60.9%) | 23.46 | -17.08 | 487.90 | Advanced, institutional bias |
Or, if you prefer a historical chart over the 12 months of our test, here it is:
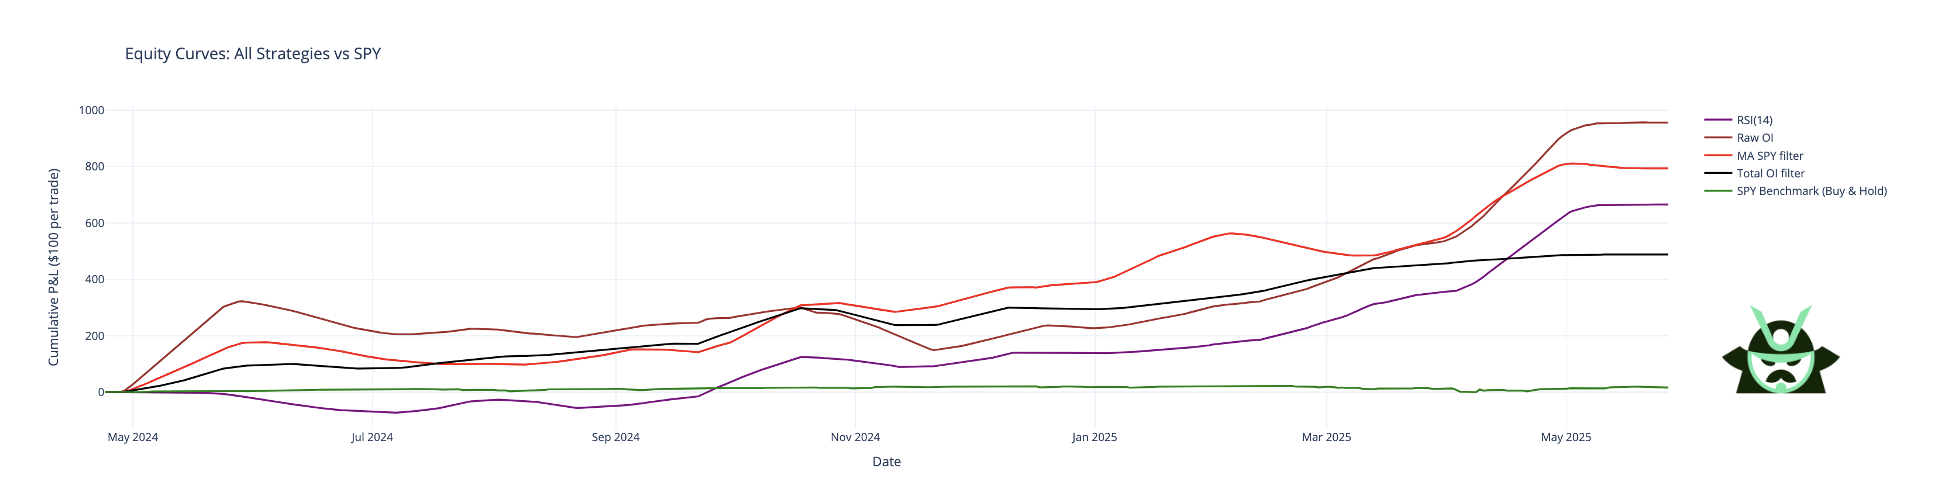
Each approach starts from the same place: our open interest report. But how you filter the signal can change the quality and quantity of trades dramatically.
Let’s break them down.
What is Our Open Interest Report and How to Use It
The open interest report shows how market participants are positioned across strike prices in the upcoming expiration cycle. It helps traders spot where large bets are concentrated and where there may be price pressure building. This is what the report normally looks like:
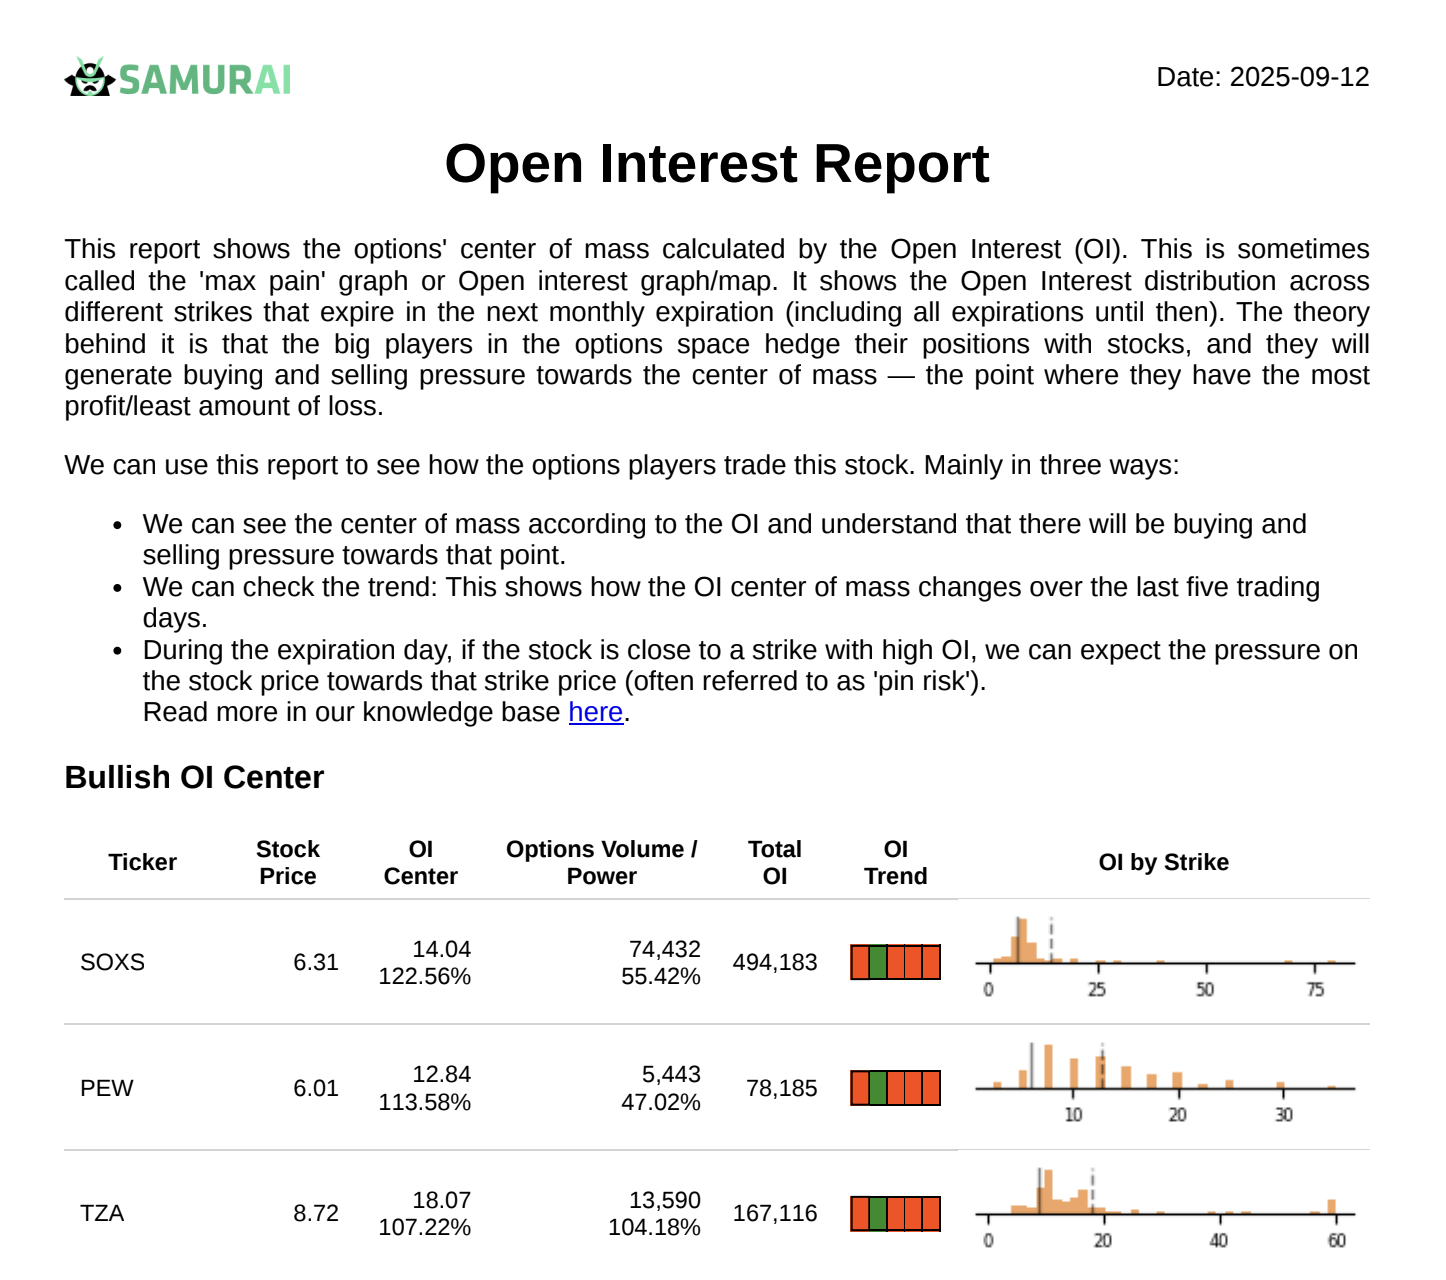
At the core of the report is the OI Center. This is a calculation based on the distribution of open interest across strikes. If the stock is trading below the OI center, we may expect buying pressure. If it's above, selling pressure is more likely. This concept helps explain the tendency for prices to “gravitate” toward areas where options exposure is concentrated.
The report also highlights divergence, or the distance between the current stock price and the OI Center. Large divergences often create short-term opportunities, especially when there’s no clear fundamental reason for the gap.
On expiration days, pin risk becomes relevant. If the stock is near a strike with high open interest, it can get “pinned” to that level as traders unwind or hedge their positions.
Each day, we rank the Top 3 bullish and Top 3 bearish tickers based on how far the stock price is from the OI Center. This is your raw signal, but it doesn’t mean every signal is tradeable.
To make the most of the open interest report, you can:
- Use it on its own to track extreme positioning
- Filter it using indicators like RSI or SPY 50MA
- Focus only on setups where total open interest is above a specific threshold
- Integrate it with your own trading method. Since this report brings its own trading edge to any strategy, you can very well add it to your toolkit to refine or validate your trades.
The report is powerful, but it’s also noisy. It’s a snapshot, not a guarantee. The strategies we test in this article (where we simulate opening a trade on a stock or ETF and close it 30 days later) are meant to filter and structure the signal to make it more actionable. As a note, consider that we are avoiding overlapping trade: if, for instance, we opened a trade on AAPL on May 15th, we would not open other trades on AAPL even if the ticker satisfies the parameters of our strategy. The idea is to have no more than one trade per ticker.
Strategy #1: RAW open interest report - trading extremes directly
This is the simplest way to use the open interest report. Every day, we take the Top 3 bullish and Bottom 3 bearish tickers based on how far the stock price is from the OI Center. The setup is mechanical:
- Go long on Top 3 tickers
- Go short on Bottom 3 tickers
- Hold each trade for 20 trading days
- No overlapping trades per ticker
This version uses no filters, no context, and no confirmation. It’s pure open interest positioning: ideal for traders who want to combine the OI signal and their own trading system or layer it with their existing analysis.
Pros:
- Systematic and easy to execute
- Active approach with lots of trades
- No need for indicators or chart reading
Cons:
- Can be noisy
- Doesn’t adapt to the market regime
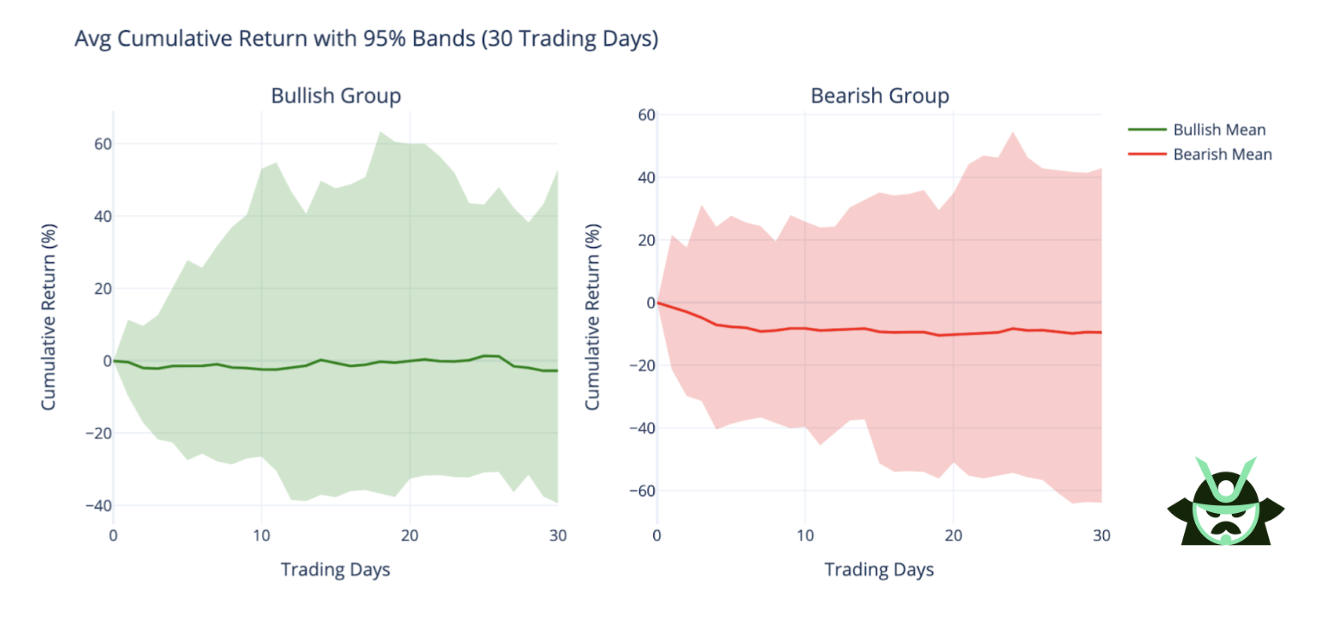
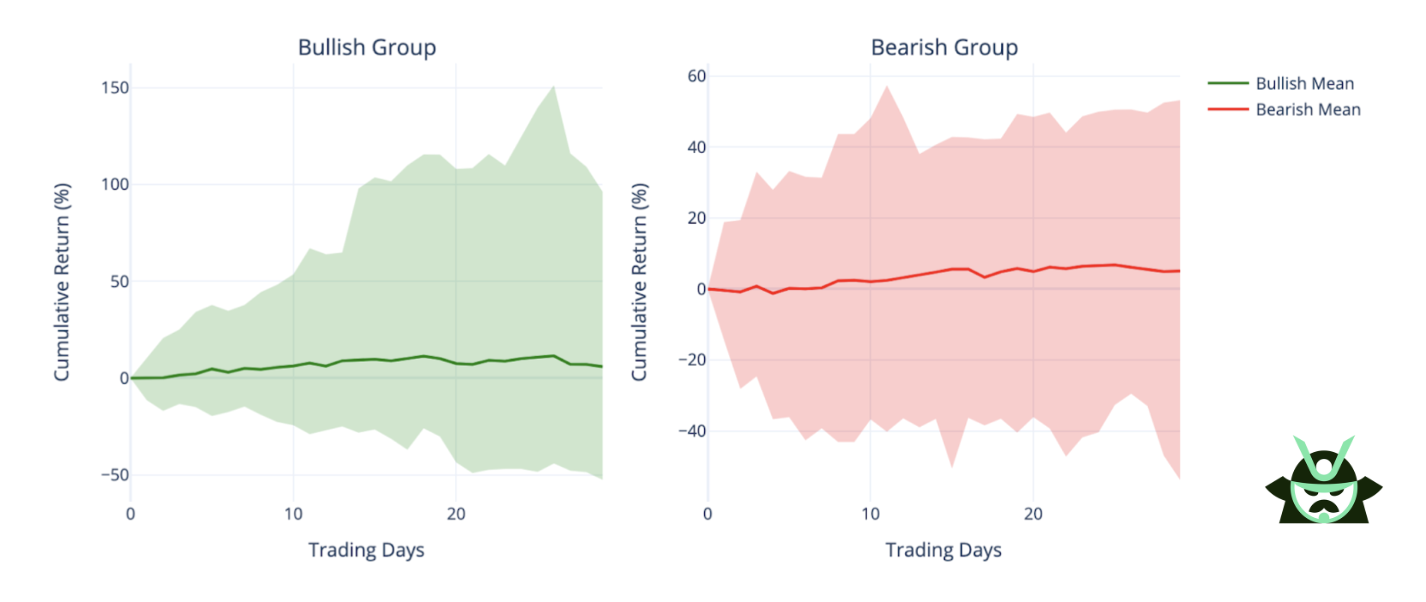
Let’s take a closer look at the chart below, which summarizes the performance of our Raw Open Interest strategy over 30 trading days:
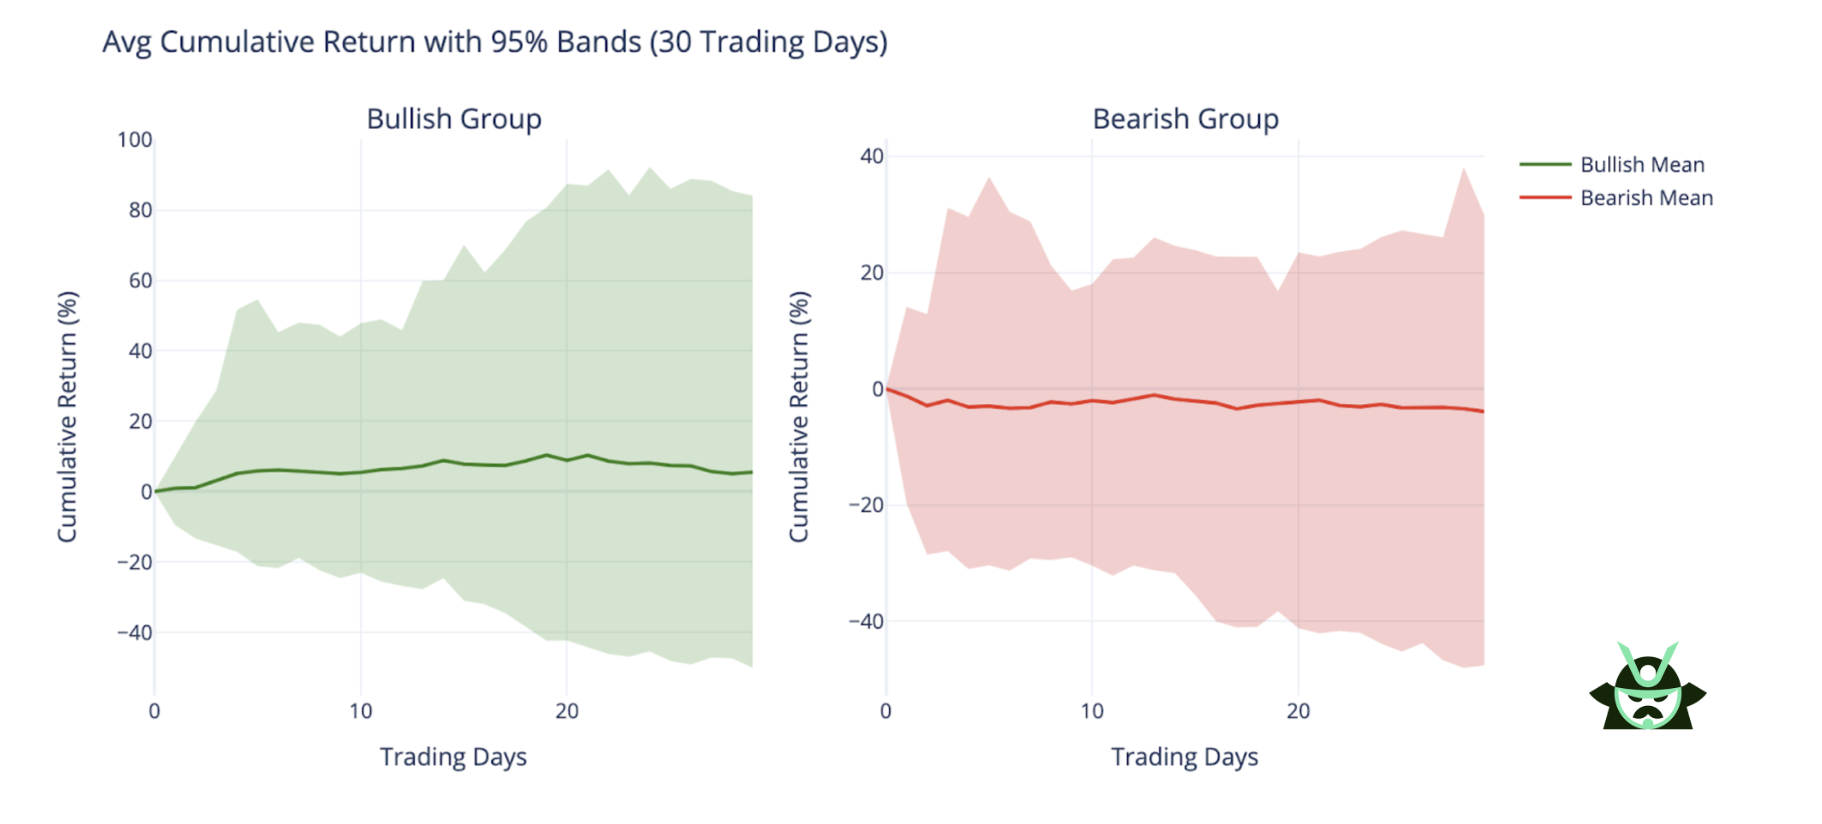
- The green line shows the average cumulative return (%) of bullish trades (top 3 signals each day).
- The red line shows the average return for bearish trades (bottom 3 signals).
- The shaded areas represent the 95% confidence bands. In other words, this is the range where most trade outcomes fell.
You can see that the bullish average stays consistently above zero, indicating a positive edge. The shaded green area ranges from around -40% to +80%, with a clear skew to the upside. This means that while some trades lost money, the majority of bullish setups performed well – and a few performed extremely well.
On the bearish side, the average return stays flat or slightly below zero, with a wider and less directional red band (around -40% to +40%). This suggests that bearish signals were less reliable, possibly due to a generally bullish market during the test period (May 2024 - April 2025).
This chart helps visualize not just the average return, but also the distribution and risk around each signal type. The wider and more volatile the band, the more uncertain the outcomes, something that traders should consider when deciding how to use the raw signal. You will see this chart a few more times below, so keep these considerations in mind.
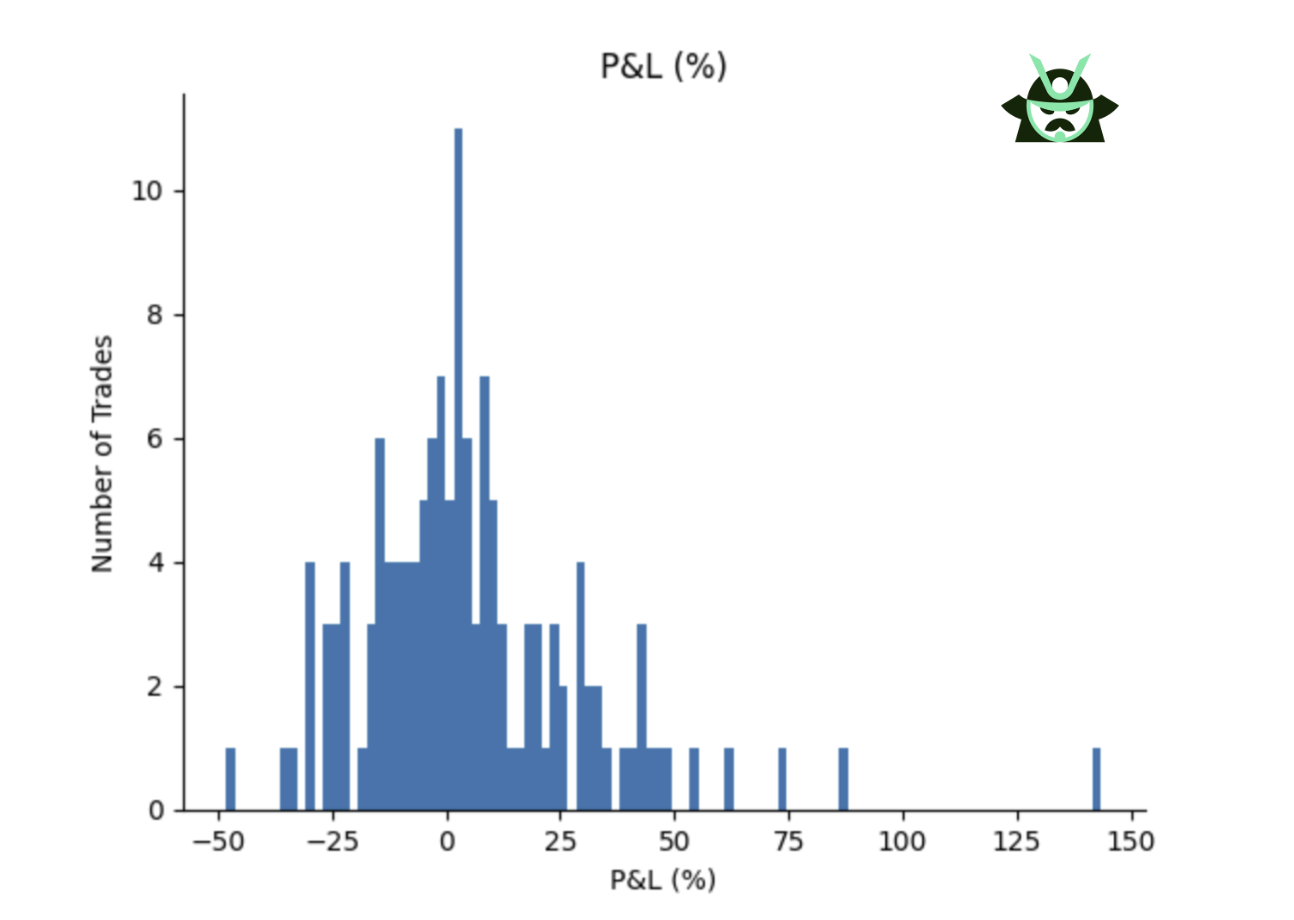
You can also see what we mentioned above in the trade distribution:
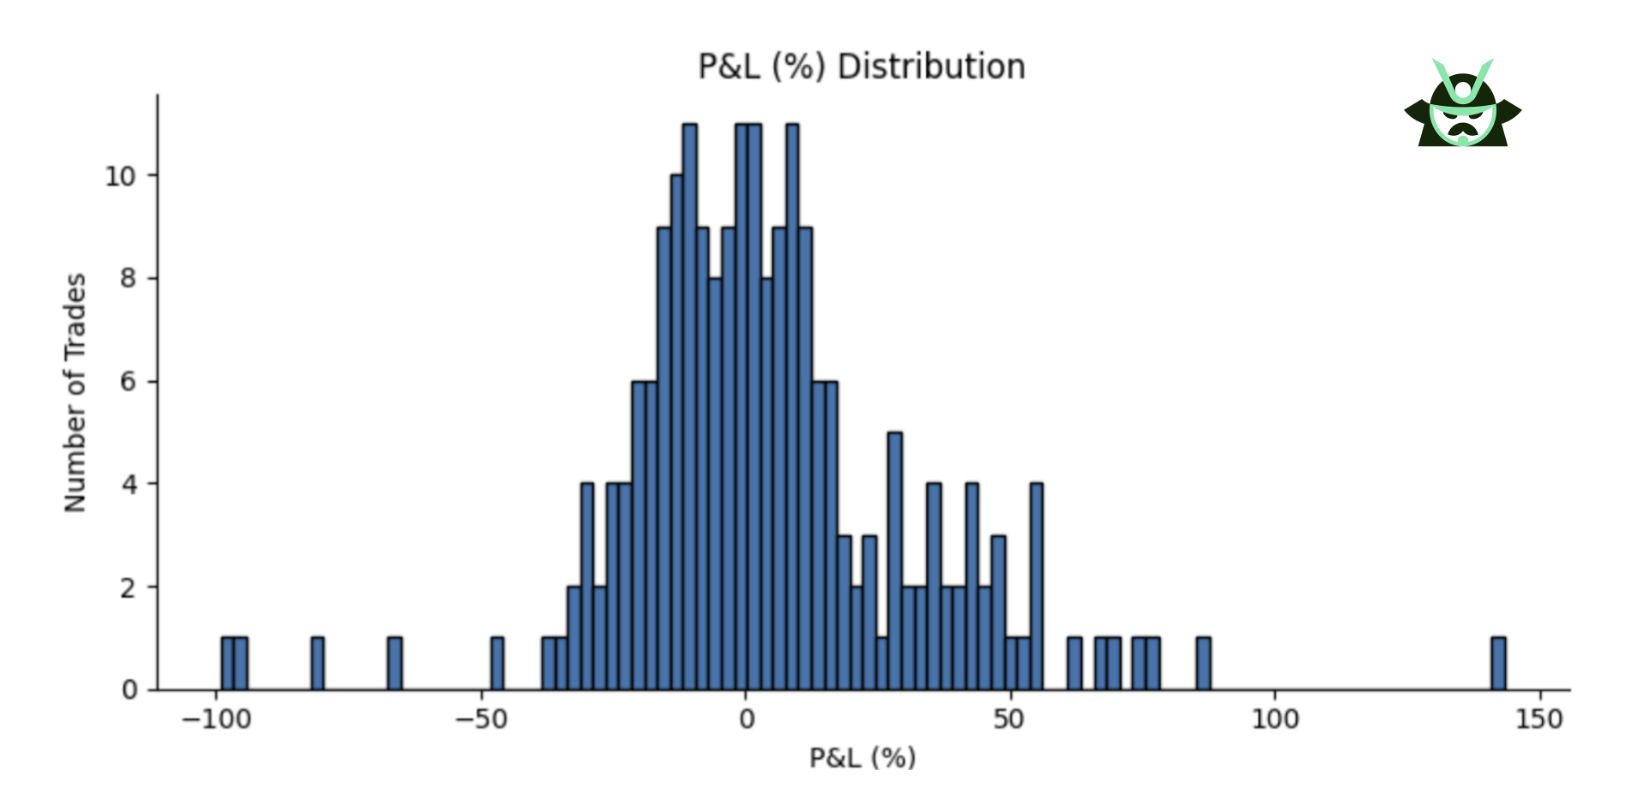
This histogram shows the distribution of all trade outcomes (bullish and bearish) from our raw open interest strategy. Each bar represents the number of trades that ended with a given P&L percentage, grouped into small ranges.
A few things stand out:
- The bulk of trades are clustered just right of zero, showing a positive average. That means more trades ended with a gain than a loss.
- There’s a long tail on the right, with some trades reaching +50% or more, and only a few losing over -5%.
- That said, it’s not a clean bell curve. There’s still plenty of noise: many trades fall below zero, especially in the 0% to -30% range.
So while this strategy isn't perfect, the positive skew in the distribution confirms it has an edge over random. On its own, this signal is already usable, especially for traders who are combining it with other rules or systems. Still, this noise is exactly why we tested filters like RSI, SPY trend, and total OI to see if we can shift the curve even further to the right.
Strategy #2: open interest report + RSI(14) - filtering with technical extremes
This strategy builds on the open interest report by adding a filter in the form of a stock indicator: RSI(14). You can change this filter depending on your approach, but here we used RSI to reduce noise and focus on technical exhaustion points. The entry rules are:
- Go long if a stock is in the Top 3 bullish and RSI(14) is below 30
- Go short if a stock is in the Bottom 3 bearish and RSI(14) is above 70
- Hold for 20 trading days, no overlapping trades per ticker
The idea here is to wait for signs of exhaustion. The open interest report gives us positioning data, but RSI helps confirm that the stock might be stretched in one direction. This combination increases the odds that a reversal is near.
This setup trades less often than the raw strategy, but when it does, the signals are cleaner. It’s a good fit for contrarian traders who want to fade sentiment extremes rather than chase moves.
Compared to the raw OI strategy, we obtain a very good P&L with way fewer trades (and, hence, this is an easier-to-monitor strategy with fewer brokerage costs):
Strategy | # Trades | Avg Win % | Avg Loss % | Total PnL % | Trading Style |
Raw OI | 215 (Win %: 53%) | 23.28 | -16.81 | 956.07 | Simple, unfiltered |
Stock filter - RSI(14) Filter | 102 (Win %: 58.8%) | 22.95 | -16.94 | 665.49 | Stock-focused |
Why use RSI?
- It gives stock-specific context to the open interest signal
- Helps avoid going long on stocks that aren’t oversold yet, or shorting stocks that aren’t overbought
- Filters for setups where the underlying is more likely to bounce or pull back
Once again, let’s look at the average cumulative P&L of this strategy:
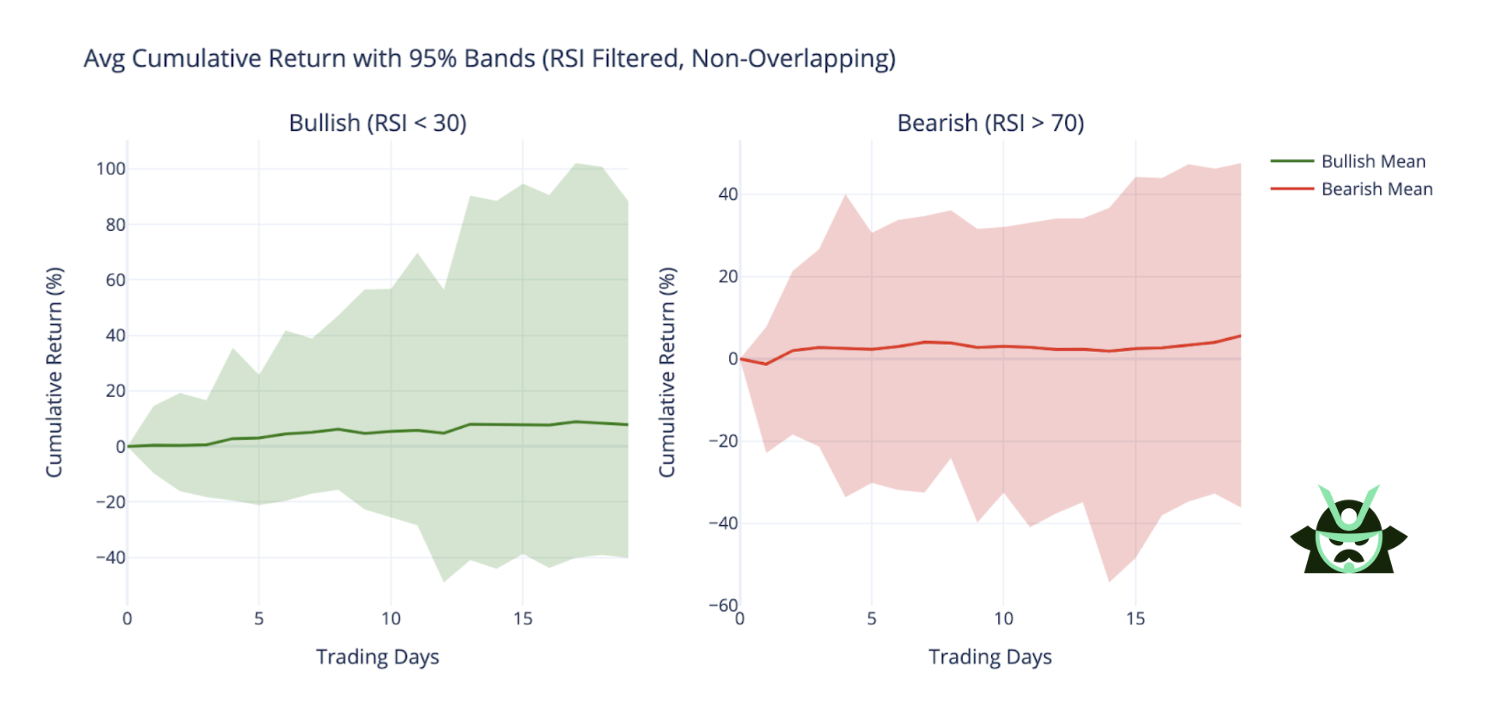
Both bullish and bearish trades show solid performance. Bullish setups clearly improve over the raw version. The bearish side becomes more consistent, showing that adding RSI helps turn weak shorts into more reliable trades.
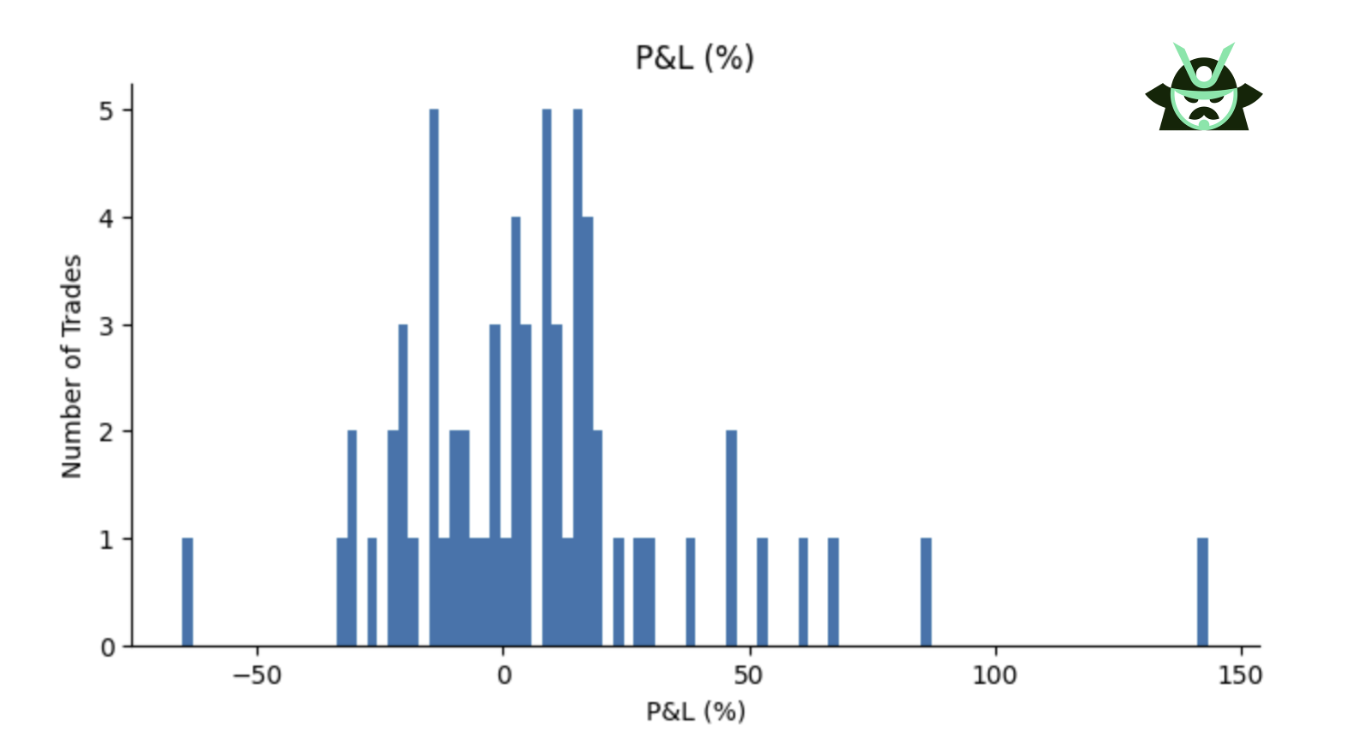
The strategy looks also solid if we check the distribution of the P&L of the single trades:
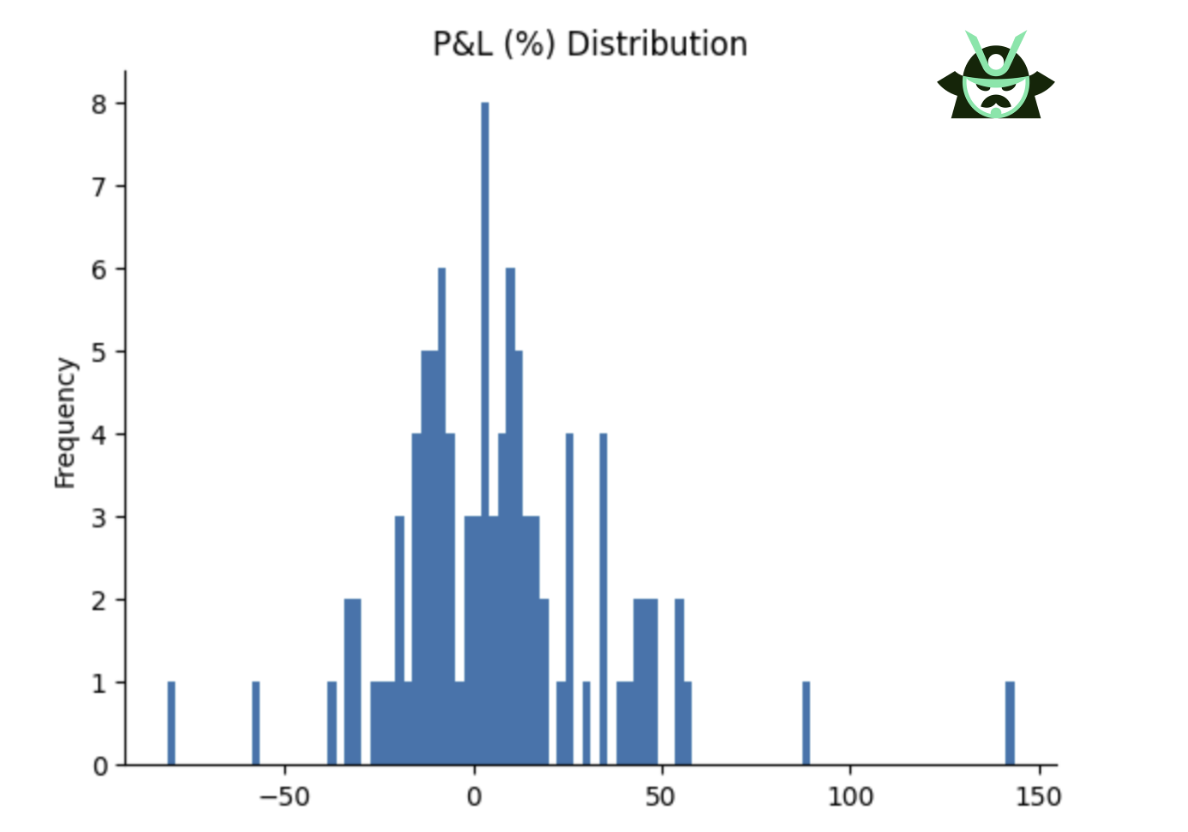
More trades end above zero. The distribution has less downside noise compared to the raw approach.
This strategy is slower but smarter. It focuses on quality over quantity and gives the open interest report a clear technical anchor.
Strategy #3: open interest report + SPY 50MA - market regime filter
This version of the strategy filters the open interest report using a basic market regime rule. The idea is simple:
- Go long only if SPY is above its 50-day moving average
- Go short only if SPY is below its 50-day moving average
- Ignore all other signals
- Trades are held for 20 days, no overlapping per ticker
The SPY 50MA helps define the trend in the overall market. Once again, if you have an indicator you prefer to use for the market trend, you can use your own version and still get an edge in your trading. The broad idea won’t change: instead of reacting to every extreme in the open interest report, this strategy only trades when the broader trend supports the signal.
This approach is slower, but it removes many of the trades that would go against momentum, as you see below in the comparison with the raw OI strategy. It’s a solid option for trend followers who don’t want to fight the market:
Strategy | # Trades | Avg Win % | Avg Loss % | Total PnL % | Trading Style |
Raw OI | 215 (Win %: 53%) | 23.28 | -16.81 | 956.07 | Simple, unfiltered |
Market filter - SPY MA Filter | 138 (Win %: 56.5%) | 21.30 | -14.46 | 793.44 | Market-aware |
Why use SPY MA?
- Gives context beyond the individual stock
- Reduces false signals during choppy conditions
- Keeps you trading with the trend (“the trend is your friend”)
Let’s start, again, with the cumulative P&L of this strategy:
Bullish trades look weaker than in the RSI-based setup. Still, most of the area is above zero. The downside moves are limited, showing this strategy avoids big losers.
The most interesting fact, however, comes from the P&L distribution:
This is where the edge shows. There are a lot of trades above zero. The distribution is tight and consistent, with fewer wild swings.
If you don’t mind having a few more trades compared to the RSI-focused approach, this strategy works well. It’s all about staying aligned with the broader market and avoiding whipsaws when the trend isn’t clear. It makes the open interest report more selective without overcomplicating the logic.
Strategy #4: open interest report + total OI filter - using institutional weight
This setup filters the open interest report to focus only on tickers with high total open interest. We tested thresholds at 100k, 200k, 400k, and 500k, but for the examples below, we’re using 500k. The idea is simple:
- Only include trades where the total OI is above 500,000 contracts
- Then apply the usual logic: go long if the stock is in the Top 3 bullish, or short if it’s in the Bottom 3 bearish
- Hold each trade for 20 trading days, no overlapping per ticker
The reason for this filter is straightforward. High total open interest usually means there’s more institutional activity, more money behind the positioning, and more signal strength. It removes low-interest, low-conviction names.
Can you use a different indicator to determine what the options market is thinking? Yes, you can. Again, if your options-related indicator gives you a better edge based on your strategy, you can just choose to apply it to the open interest report to gain a trading edge.
This approach is ideal for more conservative traders who don’t need to trade every day but want higher-quality setups. In fact, take a look at the comparison of this strategy vs the raw OI approach below. You will notice that the number of trades is much lower when you take the total open interest into account, but your entries are now much more precise:
Strategy | # Trades | Avg Win % | Avg Loss % | Total PnL % | Trading Style |
Raw OI | 215 (Win %: 53%) | 23.28 | -16.81 | 956.07 | Simple, unfiltered |
Options filter - Total OI Filter | 64 (Win %: 60.9%) | 23.46 | -17.08 | 487.90 | Advanced, institutional bias |
Why use a total OI filter?
- Filters out low-liquidity tickers
- Focuses on trades backed by real size
- Increases signal reliability, even if it reduces the number of trades
So, with the Total OI > 500,000 filter, you would get this cumulative P&L:
Both bullish and bearish setups show strong average performance. There are some big drawdowns on the bearish side, but that’s to be expected in a bullish year.
In terms of P&L distribution, here is what you would get:
The win/loss distribution looks great – clearly more trades above zero than below.
As a bonus, consider that the results hold up even at lower thresholds. For example, here are the same two charts for a total open interest above 200,000:
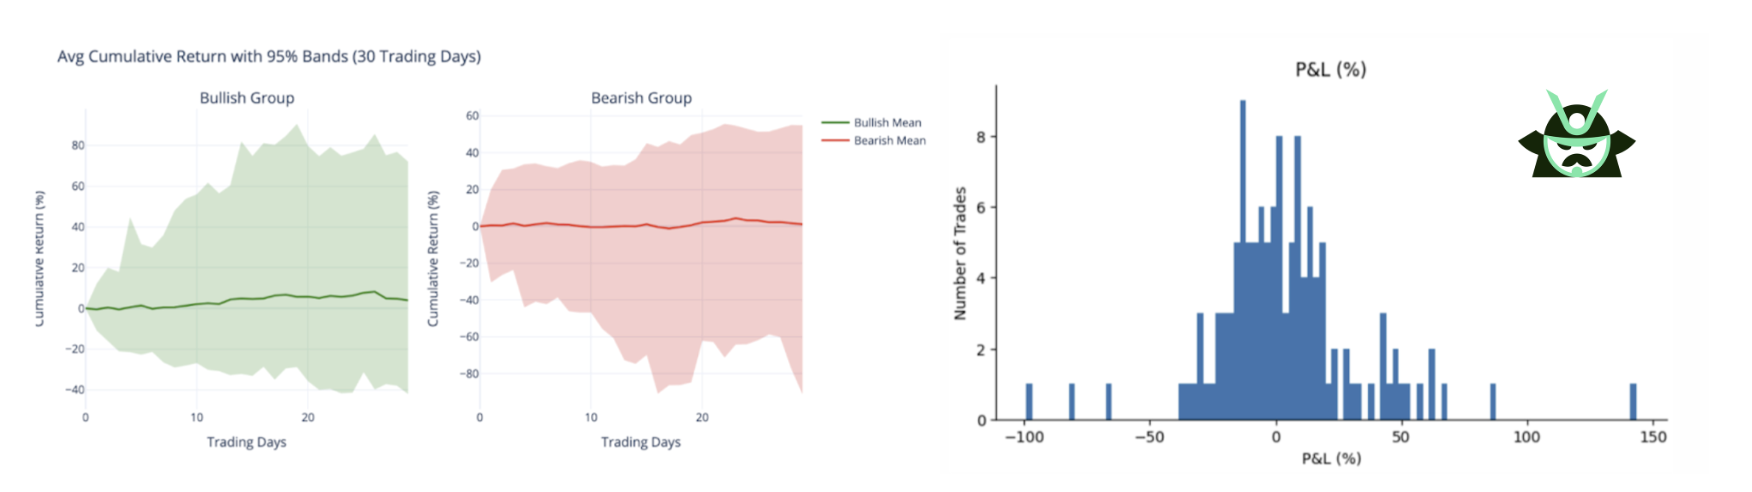
This filter makes the open interest report more serious. It’s less about signals from every stock and more about trading where the volume and money are.
Wrapping It Up
The backtests confirm it: the open interest report can give traders a real edge. But raw signals alone aren’t always enough. What makes the difference is how you filter and interpret the data.
Besides using the raw indication of the open interest report, we tested filters that reflect different “worlds”:
- RSI (14) gives you a read on the stock itself
- SPY 50MA helps align with the broader market trend
- Total OI brings in a conviction layer - it tells you where institutional money is actually active
Each filter offers a different angle. Some traders want more trades and are willing to accept some noise. Others prefer selectivity and cleaner results.
Personally, I favor the total open interest filter. It reduces the number of setups, but the quality improves. When size is behind the move, the signal tends to be more trustworthy.
There’s a lot more to explore here. If you’d like us to test other indicators, adjust the holding period, or dig into different timeframes, let us know.
Want to try this for yourself?
→ Check out an example of our open interest report here
→ Or read more about the open interest report and how to subscribe to it here
AUTHOR
 Gianluca LonginottiFinance Writer - Traders Education
Gianluca Longinotti is an experienced trader, advisor, and financial analyst with over a decade of professional experience in the banking sector, trading, and investment services.
REVIEWER
 Leav GravesCEO
Leav Graves is the founder and CEO of Option Samurai and a licensed investment professional with over 19 years of trading experience, including working professionally through the 2008 financial crisis.