By Leav Graves
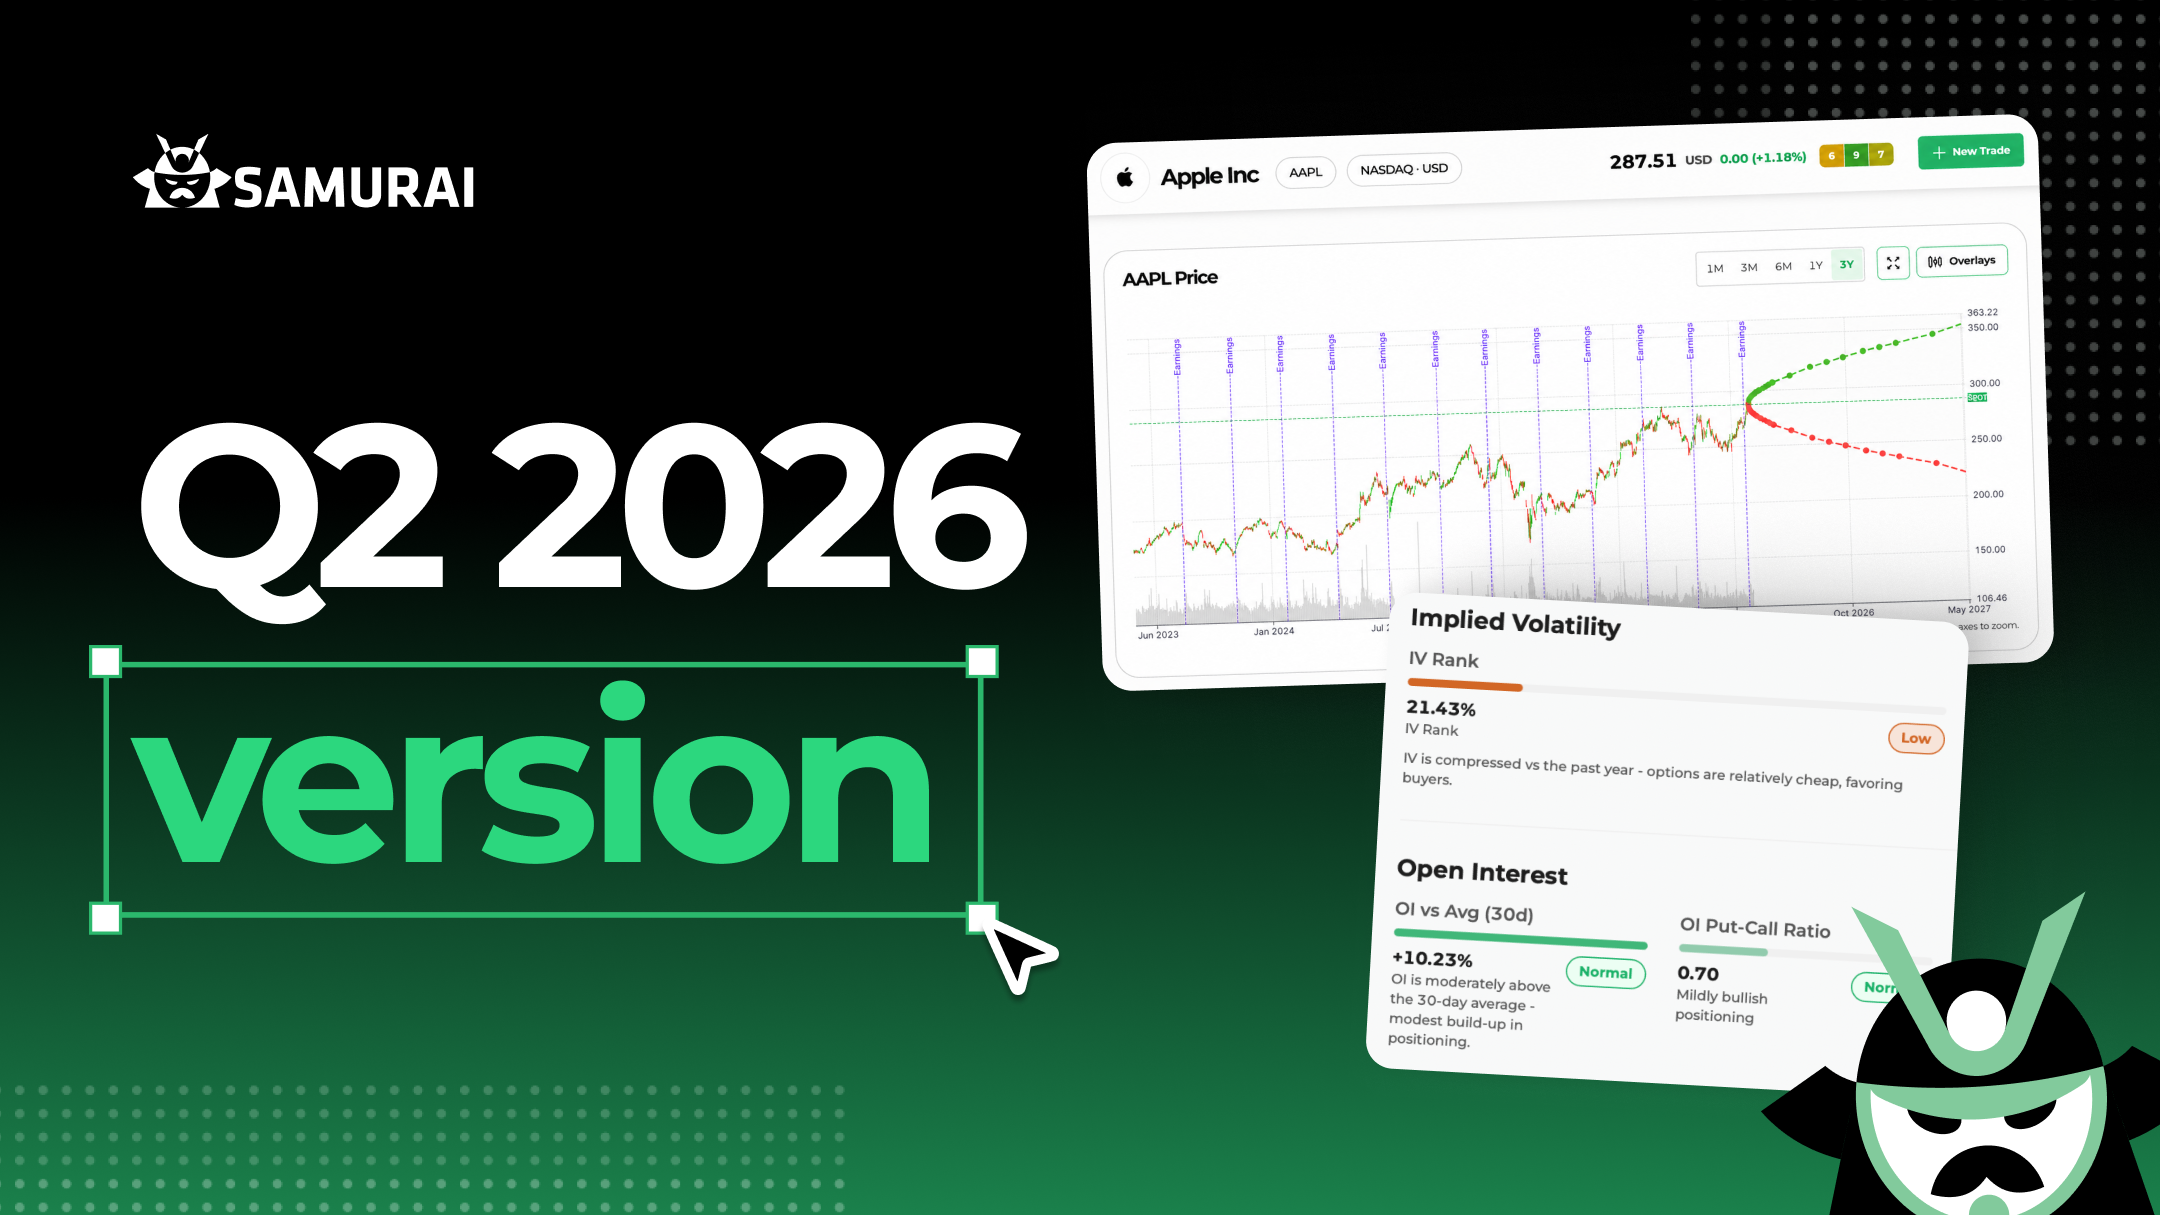
Markets had plenty to digest this quarter, from a new Federal Reserve chair to ongoing geopolitical tension feeding into energy prices and inflation. When the macro picture gets noisy, the edge comes from doing your homework on each name - and that's exactly what this release is about. We're introducing Research, a new home for analyzing any stock or ETF before you trade it. Think of it less as a single feature and more as a canvas: this is the starting point, and you'll see new tools added to it in the quarters ahead.
Here's what we included in this Q2 update:
- Research, a dedicated hub to analyze any stock or ETF before you trade
- Sort by sector
- Faster servers and an improved data engine
- General improvements and bug fixes
Research
This is the headline of the quarter. Until now, the Screener has been your starting point for scanning the entire market and finding opportunities. Research is the other half of that story: instead of looking across the whole market, you go deep on a single ticker.
The idea behind it is something we've wanted to build for a long time: stock research from an option trader's perspective. There are plenty of places to look up a stock, but almost all of them are built for equity investors. We wanted a place that answers the questions option traders actually ask about implied volatility, options activity, expected moves, and how a name fits the trades you're considering. So everything you need to evaluate a stock before placing a trade is now in one place: price history, the company's fundamentals, implied volatility, and options activity.
We've also moved the Analyzer into this section and have been using it on our own trades for weeks now. You don't have to jump between tools and external sites anymore: and that will become increasingly true as we keep adding features here (because yes, we have a long list of pages and widgets planned).
You'll find Research in the top navigation bar. Every ticker has its own URL, so you can bookmark the stocks you follow and jump straight back to them.
Stock Analysis
This is the main research panel, and it's a single scrollable view you can work through top to bottom (or jump around using the sidebar). It covers:
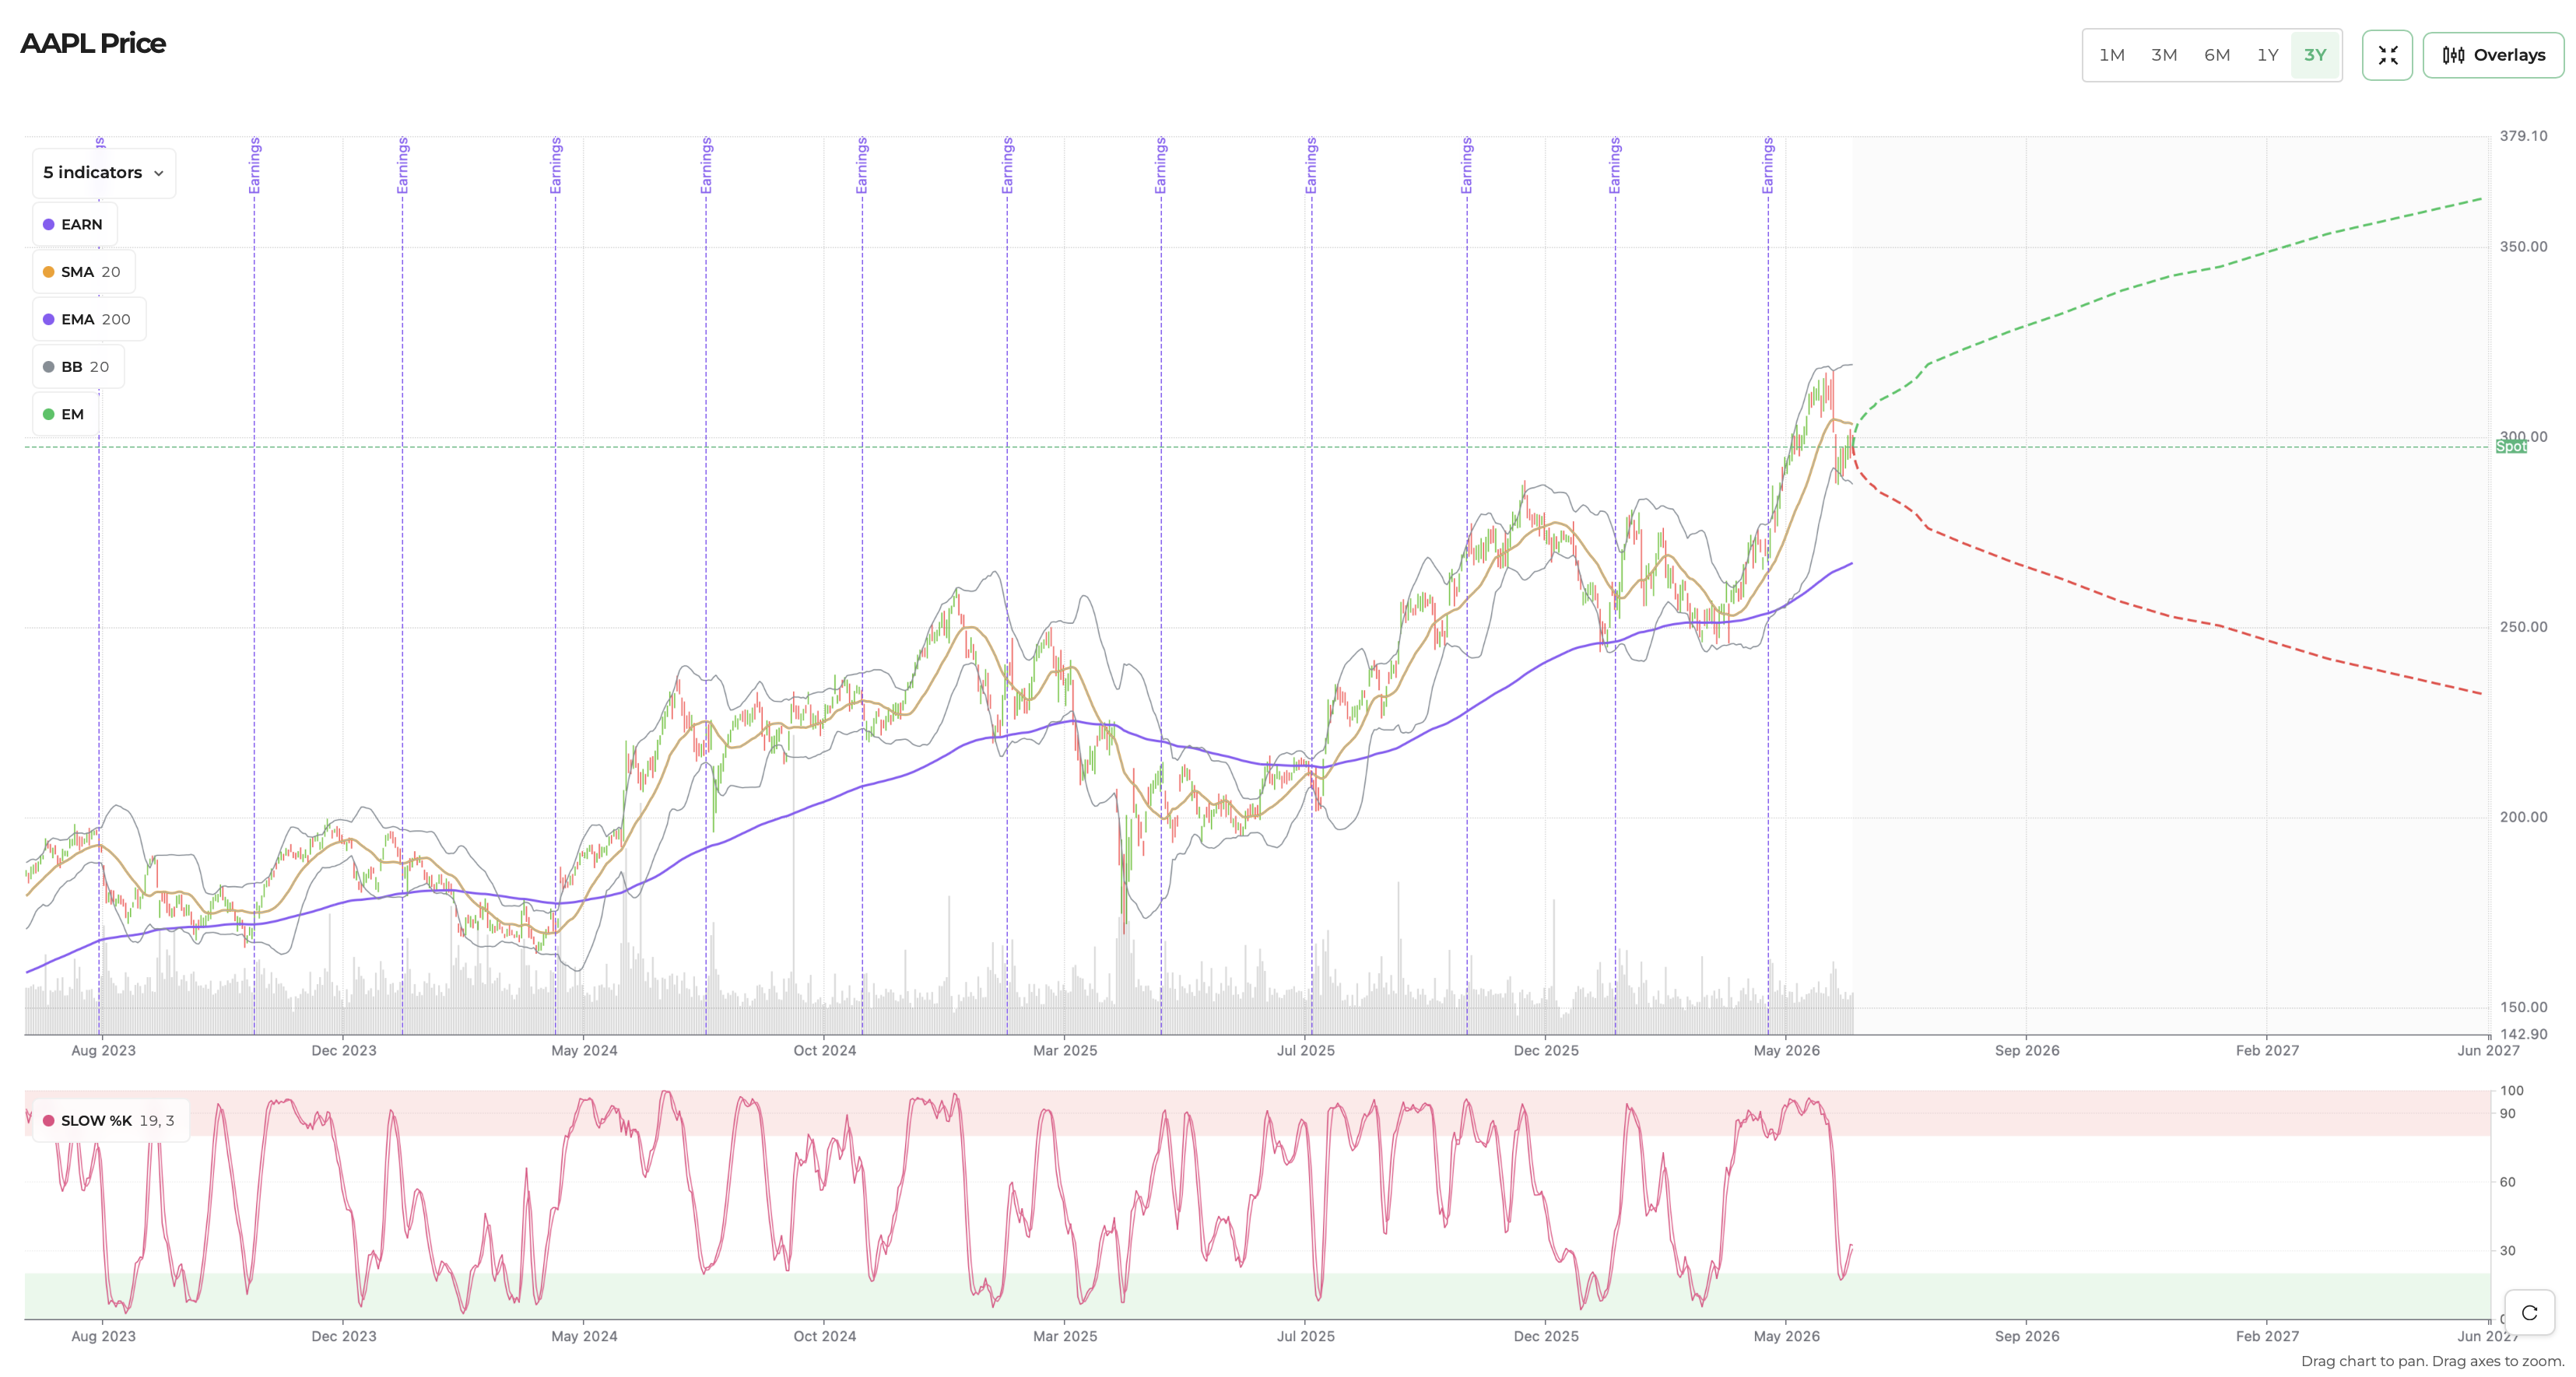
- Price chart: because options are all about the future, this chart shows both sides of the timeline. The past comes through price history and technical indicators (MACD, RSI, moving averages), and the future through overlays like the expected move, analyst price targets, and upcoming earnings dates. You have multiple time frames, all toggleable.
- Company profile: what the company does, plus the data that matters before trading options on it (market cap, float, average volume, 52-week range, beta, and the next earnings date).
- Financial metrics: the full fundamental and valuation picture in a quarterly or yearly view, with charts on top and a detailed table below.
- IV / OI / Volume: a quick, human-readable read on the options market – current IV and IV Rank, today's open interest and volume, and the put-call ratios, each labeled normal, high, or low so you can judge it at a glance.
- Relevant scans: answers a question traders ask constantly: which of my scans does this stock match right now? Samurai checks your saved scans in real time and shows the matches. Especially useful when you already own the stock and want to see what new ideas are surfacing for it.
Implied Volatility Analysis
For options traders, this is one of the most important parts of Research: it tells you whether options are expensive or cheap relative to their own history, and what the skew says about sentiment.
At the top you get the headline context immediately: IV Rank and the IV - HV differential, each with a clear label. We also let you change the parameters and analyze the historical data.
Below that, charts overlay IV against historical volatility over the past year so you can see how unusual current conditions really are, and the Skew Analysis panel translates the numbers into a plain-language read (bearish, neutral, bullish).
➡️ And this is just the start: more sections and widgets are already in the works and rolling out in the coming weeks.
Sort by Sector + Industry filter coming soon
We also continued improving the screener with a highly requested change: you can now sort the sector filter alphabetically, A-Z or Z-A. It's a small thing, but several of you asked for it.
And a quick preview of what's next: we're adding Industry as a brand-new data point. You'll be able to use it as both a filter and a column, pick multiple industries at once (organized by sector so they're easy to find), and sort by it. Look for it in the next version.
Faster Servers and Improved Data Engine
Behind the scenes, we migrated to better, faster servers to make the platform quicker and more reliable. Our new infrastructure also provides better redundancy and improves service uptime. We also improved our data engine to provide better trades, faster scans, and snappier responses.
General Improvements and Bug Fixes
As always, we continued to fix bugs and refine existing features across the platform. We also started working on the next version, and you can expect more features coming soon, including better Alerts, improved watchlists, more data points, and a few more we will announce in the future.
The new version is live! Log in to Option Samurai and start exploring Research, the new filters, and the rest of this quarter's updates. And as always, feel free to reach out with feedback and suggestions; it helps us decide what to build next.
AUTHOR
 Leav GravesCEO
Leav Graves is the founder and CEO of Option Samurai and a licensed investment professional with over 19 years of trading experience, including working professionally through the 2008 financial crisis.