Option SamuraiSTART FOR FREE

The Options Dojo

Featured

Our latest video

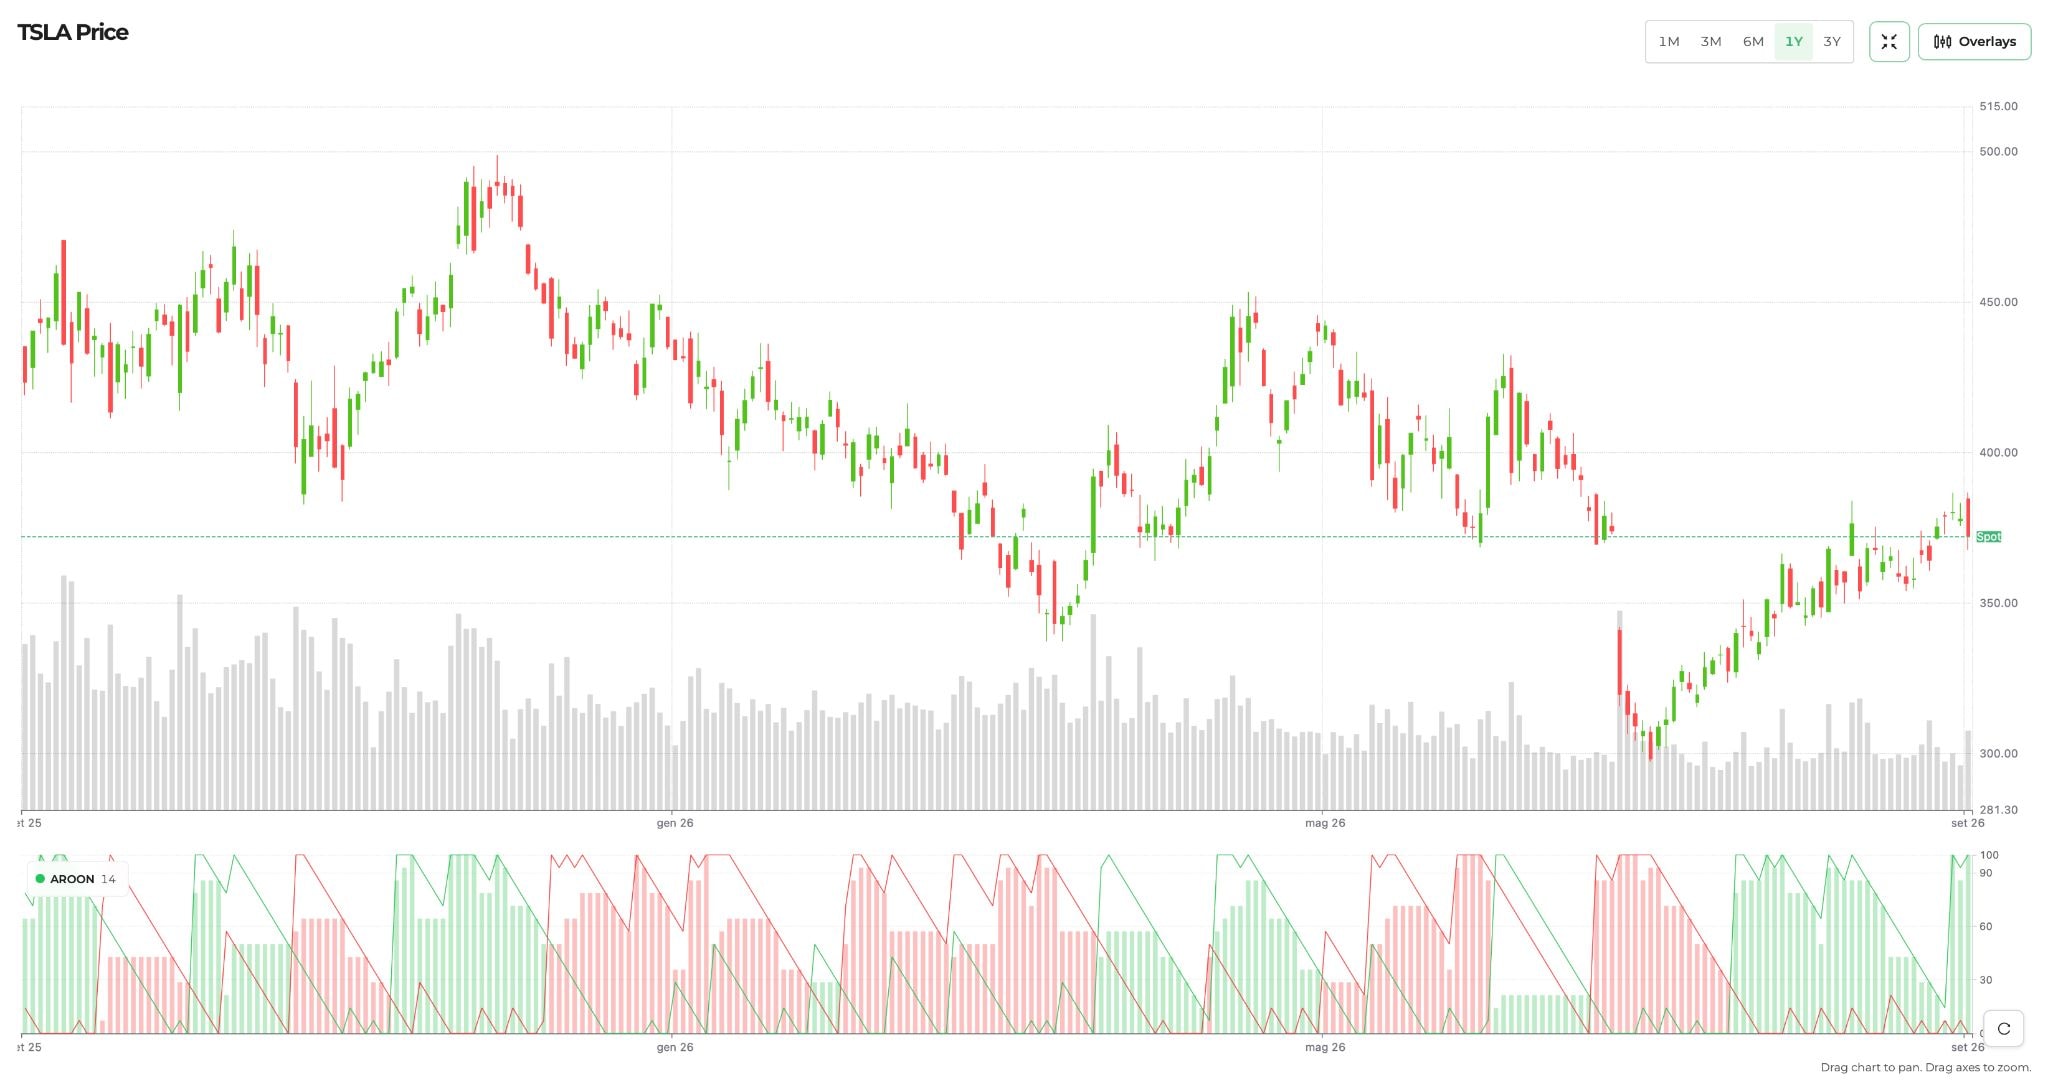
This Trading Indicator Shows How Fresh a Trend Really Is

Most traders find trends when they are already old. Price has already run, momentum looks great on the chart, and you enter just as it stalls. What if you could measure how fresh a trend really is? In this video I show you how to use the Aroon trading indicator, using Apple as the example. You will see how Aroon Up and Aroon Down track how recently price made a new high or low, and how to use that reading inside Option Samurai. In this video you'll learn: 1.⁠ ⁠How to read Aroon Up and Aroon Down and spot a fresh move into the uptrend zone 2.⁠ ⁠How to scan for "Moved into uptrend" with Length 14 and Oscillator between 50 and 100 3.⁠ ⁠How to check Aroon for any stock you already watch in Research 4.⁠ ⁠How to turn a scan result into a trade idea with an Apple call option 5.⁠ ⁠How to backtest the signal on Apple to see average forward moves and positive rate Instead of guessing if a trend still has room, you start from how recently it began. The backtest checks the stock's behavior after the signal, not the profit of the call option. Chapters 0:00 Intro: Apple just flipped bullish on Aroon 0:17 How Aroon works: Aroon Up vs Aroon Down 0:44 Scanning for fresh uptrends in Option Samurai 1:04 Scan settings 1:14 Checking Aroon on stocks you already watch 1:30 Trade idea 1:51 Backtesting the Aroon signal ────────── About Option Samurai Option Samurai helps you find better trades faster. Our scanner, watchlists, and Excel plus Google Sheets integrations are built for serious options traders who want clarity, speed and an edge. The scans shown in this video are live inside the platform with full profit and loss visualization so you can see risk before you commit capital. ────────── 🚀 GET STARTED 🌍 Try it free: https://optionsamurai.com 📖 Backtest explained: https://optionsamurai.com/blog/backtesting-aroon-filter/ ────────── 👍 Like this video if it helped you 🔔 Subscribe for more options trading strategies and tools 💬 Drop a comment if you have questions or ideas for future videos Chapters
Trades

Trade Idea - Down Put Butterfly on SPY

3 min read

A SPY 700/709/719 put butterfly expiring December 18, 2026: a $68 debit, $932 maximum profit and a 718.32 breakeven, before costs.

Education

Credit Spread Ladder - How to Build a Routine Instead of a Launch Day

7 min read

Learn how a credit spread ladder works: open spreads on different dates, size by max loss, follow simple rules and find trades with our scanner.

Trades

Trade Idea - Iron Condor on SPY

2 min read

A defined-risk iron condor on SPY, 10 days out, with elections, the jobs report and CPI inside the trade window: strikes, credit, breakevens and the full setup.

Blog Categories

6 articles shown for All

Blog List

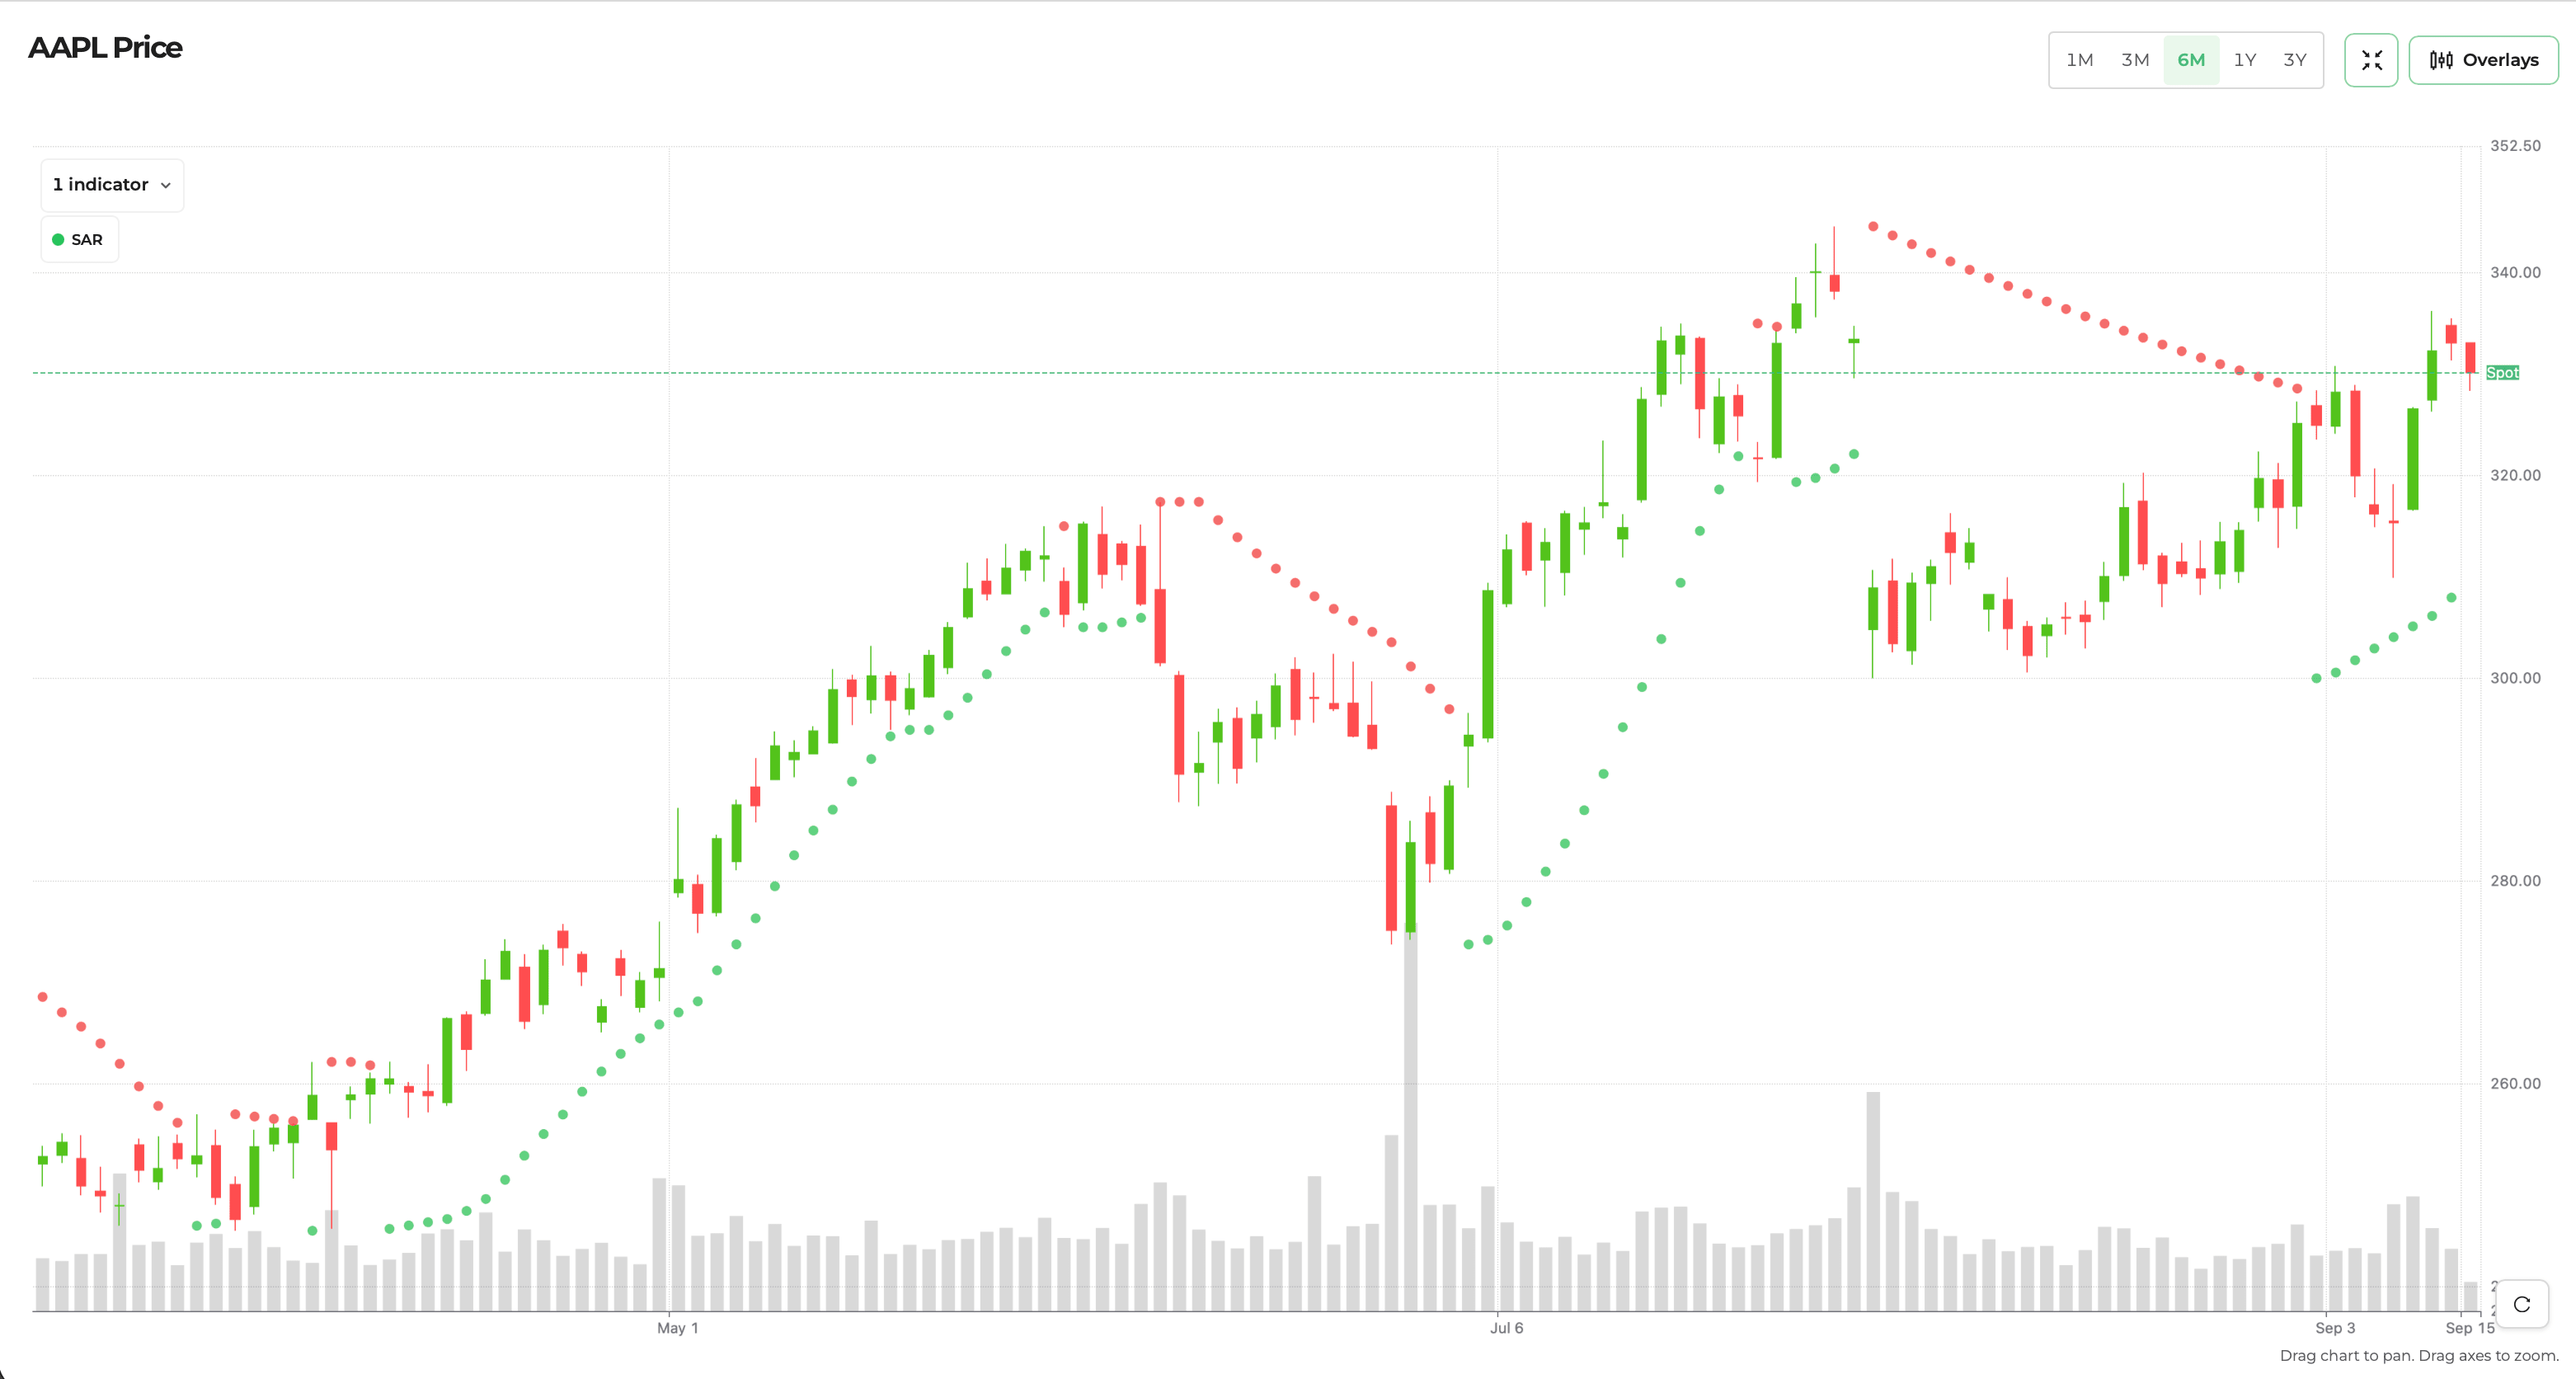
SAR indicator
Research

Backtesting the Parabolic SAR Filter on Any Stock [Free Backtest File]

7 min read

How to read a Parabolic SAR backtest: edge vs. baseline, mean vs. median, and the six checks to run before trading a SAR signal. Free backtest file inside.

fig1_pypl_three_states adx
Research

Backtesting the ADX Filter on Any Stock [Free Backtest File]

10 min read

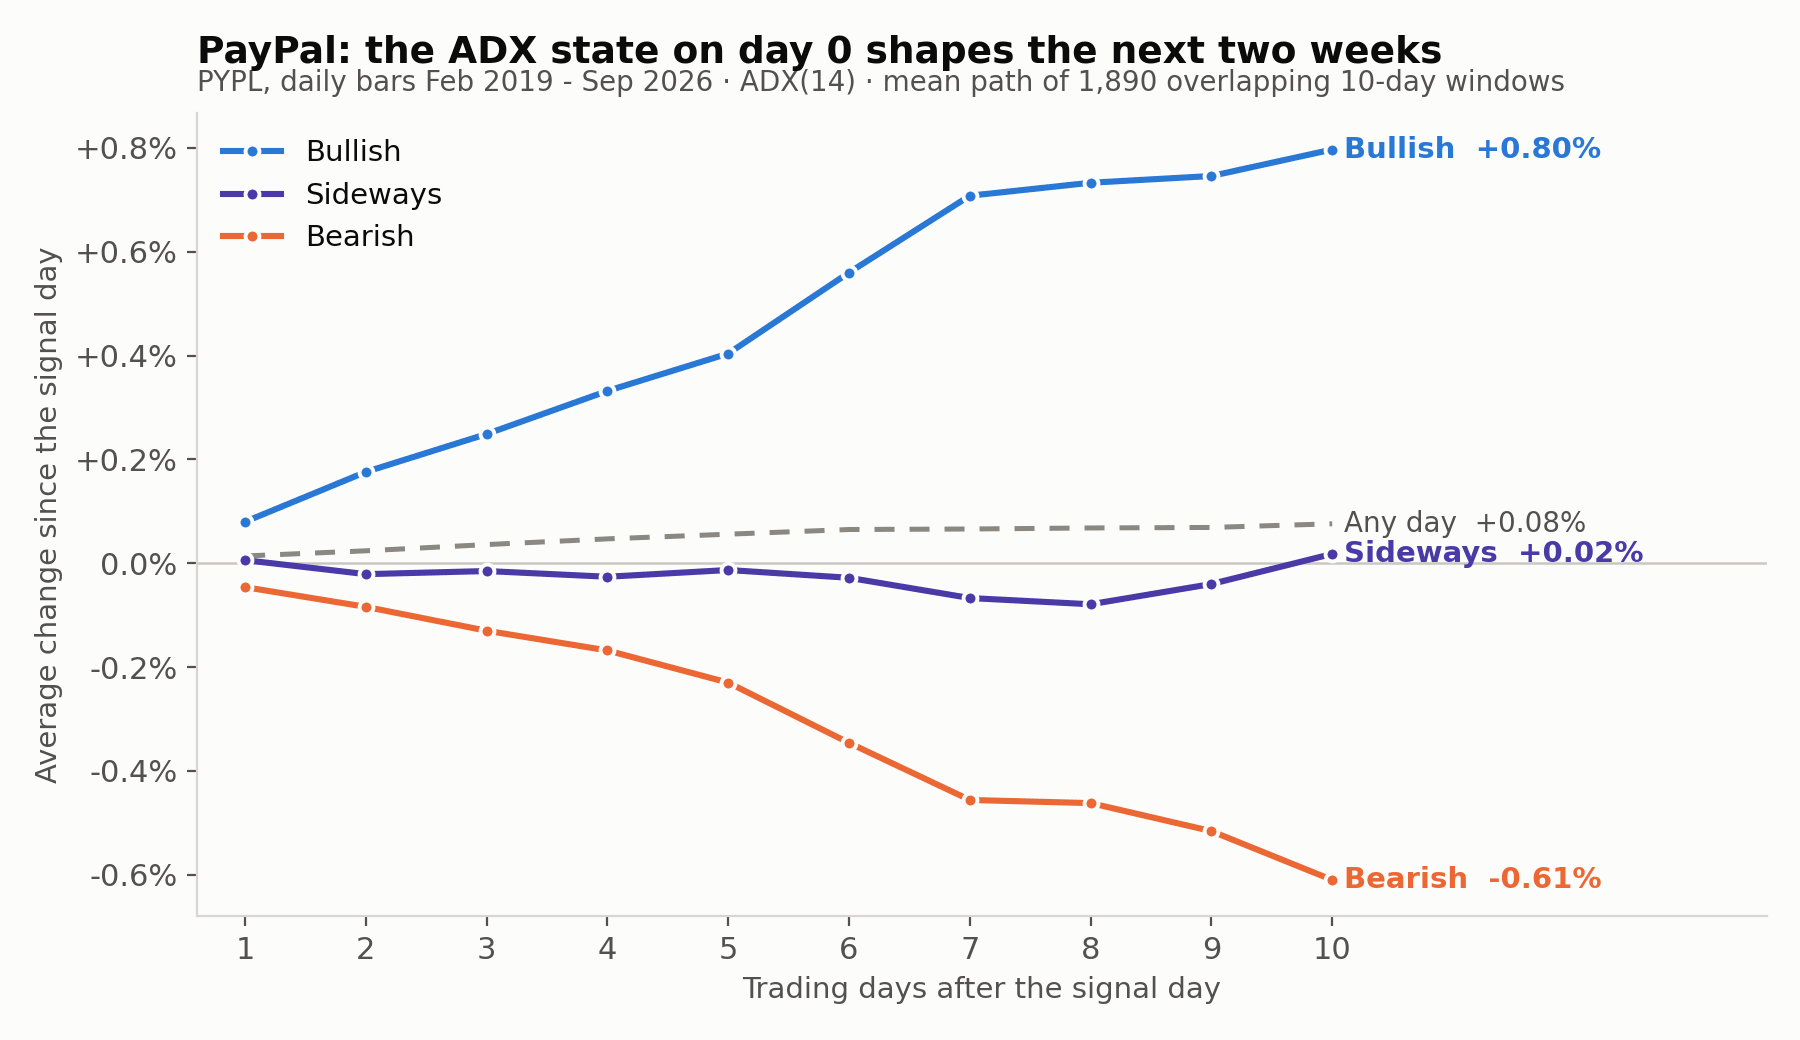
See what ADX sideways, bullish and bearish readings actually did on a stock over the next two weeks, and how to spot a false edge. Free backtest file inside.

Education

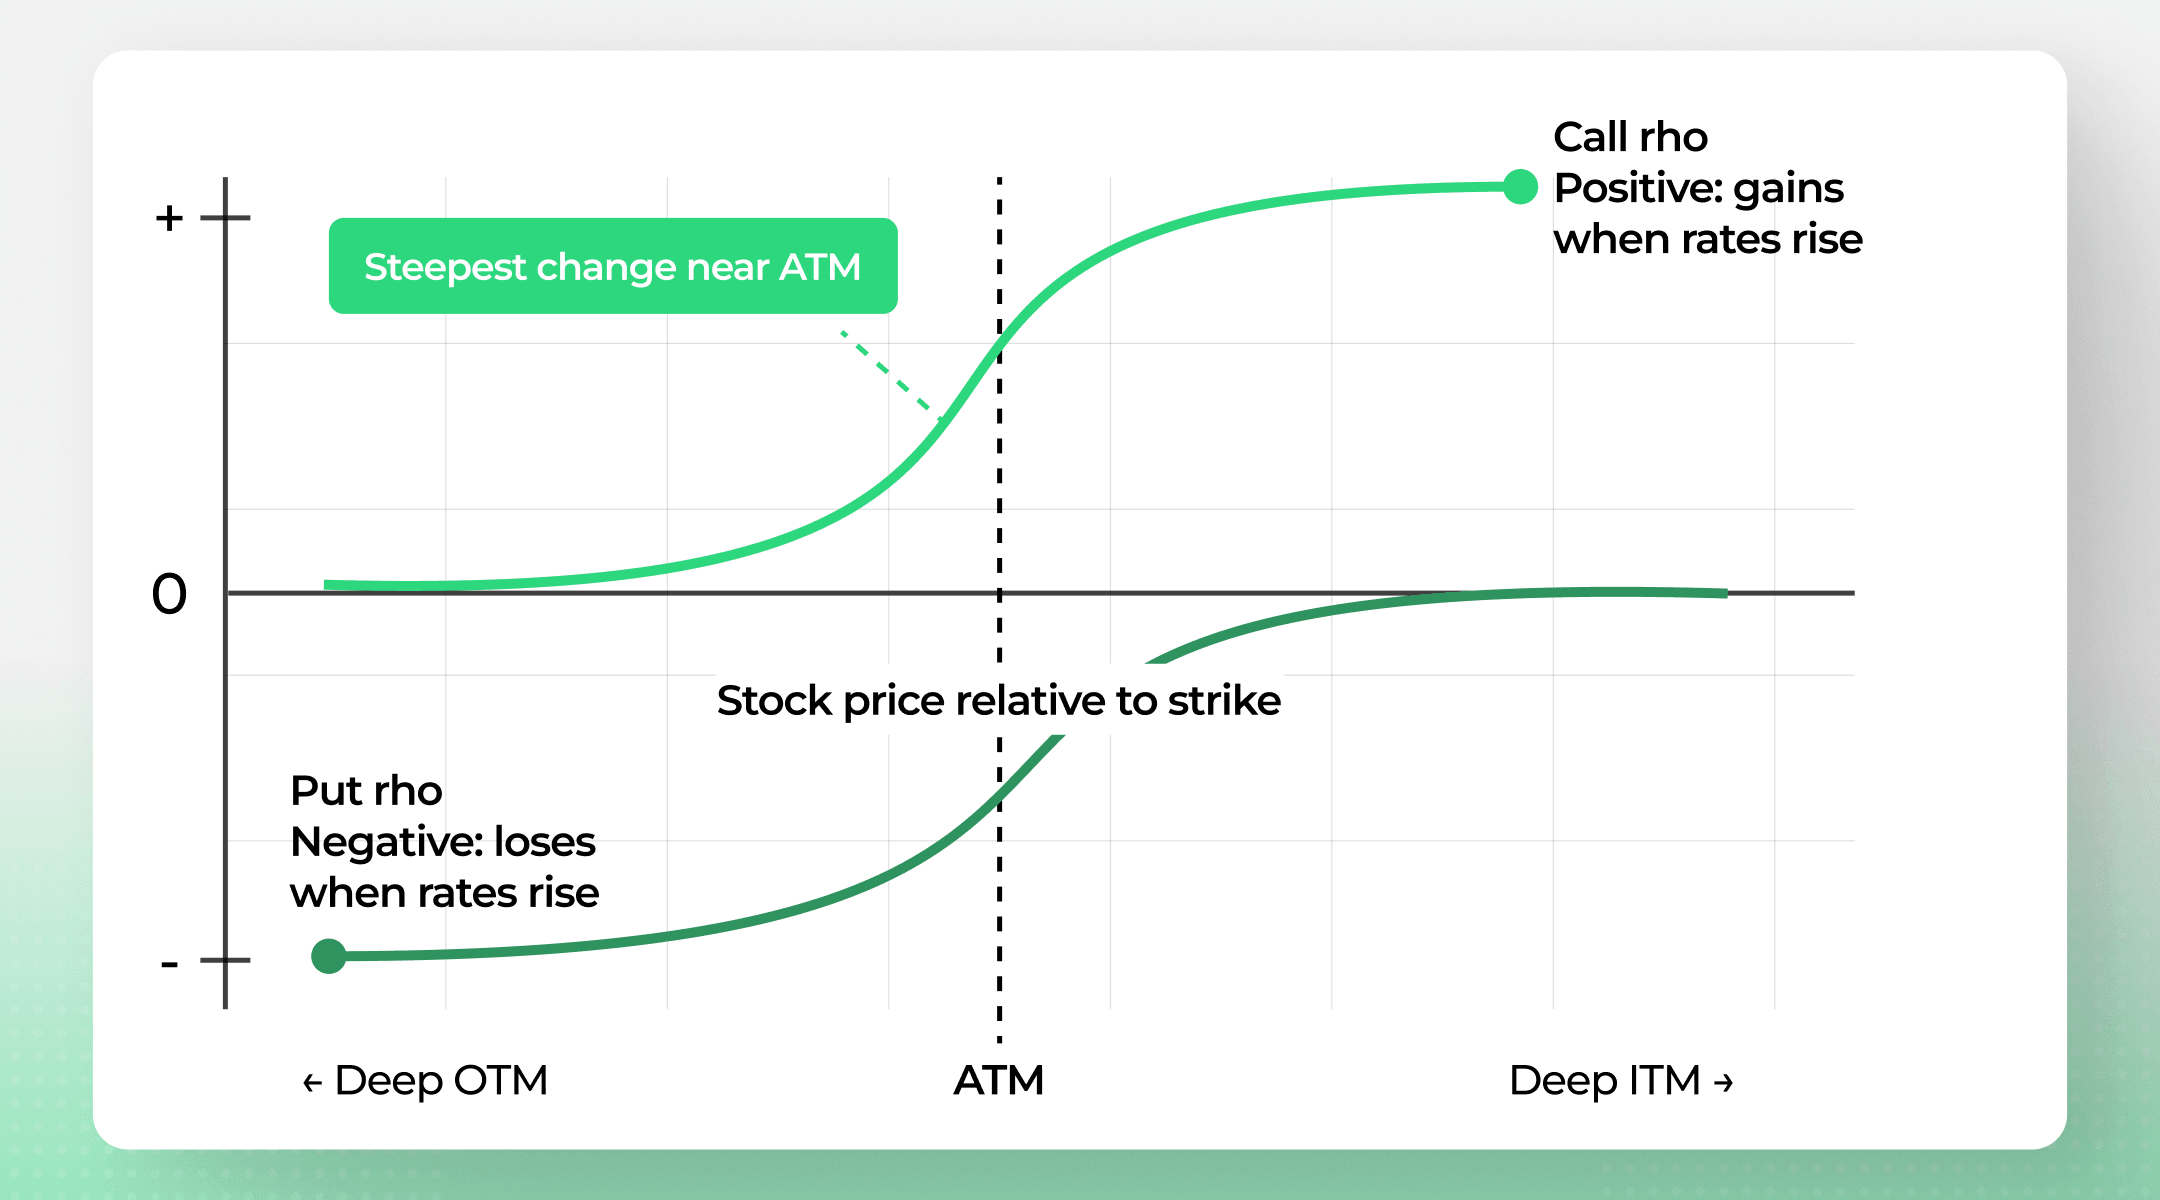
What Is Rho in Options?

6 min read

Learn what rho means in options trading, how interest rates affect option prices, and when rho matters most. Explained with clear examples for calls and puts.

1. barchart_positive_shock
Research

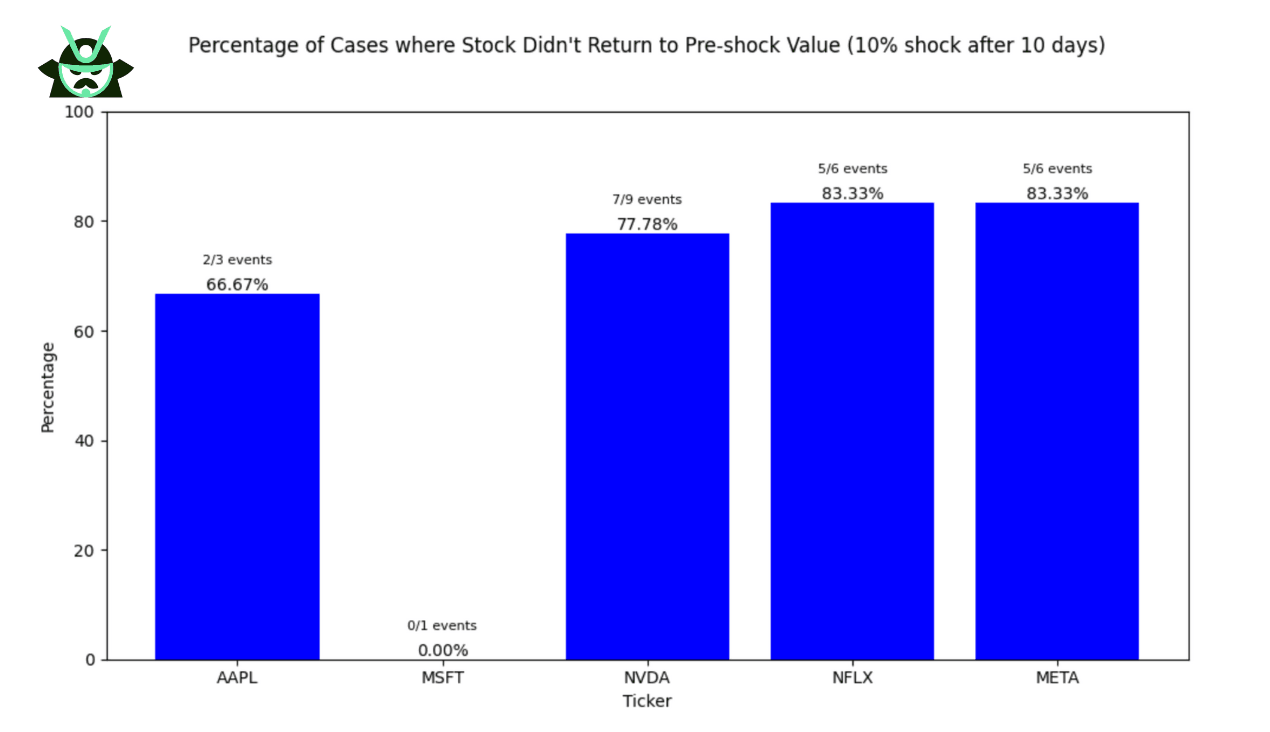
Trading Earnings Events with Options - A Backtested Strategy

13 min read

After an earning event, stocks can experience a sudden price change depending on the way the market interprets the company's performance. This can be an opportunity for traders to capitalize on...

covered put
Education

The Basics of the Covered Put Strategy: What You Need to Know (and How to Handle Risk)

10 min read

When you have a short position on a stock, a covered put strategy can help you generate income and manage risk. By selling covered put options, you can earn premiums to reduce your short position's...

black scholes option pricing model
Education

How are Options Priced? A Clear Explanation [Beginner-Friendly]

8 min read

While it may be relatively straightforward to understand how stock prices work, options pricing can be a bit more complex. Options pricing is determined by intrinsic and extrinsic values. So, how...

Featured Videos

Selling Puts: Why 20 Delta Fails and What to Check Instead thumbnail

Selling Puts: Why 20 Delta Fails and What to Check Instead

Most traders selling puts pick the strike by gut. Delta 20 sounds smart, the premium looks nice, so they sell it. Then price slides under breakeven, assignment looms, and they realize they never wanted to own the stock at that price in the first place. In this video I walk you through the 9 checks I use inside Option Samurai to pick a short put strike with data instead of guessing. We start with a ticker you already have in mind, compare different stocks on the same scale, then compare expirations by return. We finish with a simple question: would you actually be happy to own 100 shares at this price? In this video you'll learn: 1.⁠ ⁠How to use 20 delta as a baseline without treating it as an exact probability 2.⁠ ⁠How to put support and breakeven on the same chart to see how much room you have 3.⁠ ⁠How to read expected move from option prices and use its lower edge when choosing a strike 4.⁠ ⁠How to use probability of expiring worthless to compare strikes 5.⁠ ⁠How to compare different stocks in ATR and standard deviation units 6.⁠ ⁠How to compare annualized return at equal probability across expirations 7.⁠ ⁠How to use IV Rank and timing to assess the premium on offer 8.⁠ ⁠How to keep earnings outside the trade 9.⁠ ⁠How to check PE, dividend yield and the 200-day average relative to your strike before deciding whether you'd be happy to own the shares ⸻ About Option Samurai Option Samurai helps you find and compare options trades. In this video, I use the scanner and Research tools to work through strike selection, compare candidates and check the stock behind the trade. ⸻ 🚀 GET STARTED 🌐 Try Option Samurai free: https://optionsamurai.com/free-trial 📖 Read more on the Option Samurai blog: https://optionsamurai.com/blog ⸻ 👍 Like this video if it helped you tighten up your strike selection 🔔 Subscribe for weekly options strategy breakdowns 💬 Comment with the ticker you are looking at next Chapters 0:00 Why Strike Choice Matters 1:03 20 Delta as a Baseline 1:43 Support and Breakeven 2:40 Expected Move Lower Edge 3:36 Probability of Expiring Worthless 4:00 ATR and Standard Deviation 5:06 Annualized Return Across Expirations 5:27 IV Rank and Premium Timing 5:54 Keep Earnings Outside the Trade 6:28 Would You Own 100 Shares?

What 80 Parabolic SAR Flips Say About the Next 10 Days thumbnail

What 80 Parabolic SAR Flips Say About the Next 10 Days

Parabolic SAR is usually taught as a picture. Dots under the price mean uptrend, dots over the price mean downtrend. That is the definition, and it is where most traders stop reading. The dot is a trailing stop. The distance between price and the dot is the part that pays, because it tells you how much room the trend has before it breaks. A stock sitting 1 percent above its dot is one candle away from a flip. A stock sitting 6 percent above its dot can absorb a bad day and keep going. Same signal, two completely different trades. In this video I show you the full chain in order on one ticker, Salesforce. Read the dot. Measure the gap as a percentage. Scan for the flips that just happened, not the ones that happened three weeks ago. Set the strike off the dot instead of off a round number. Then test the signal against every flip the stock has produced since 2019, so you know whether the pattern is a real edge or a random day wearing a costume. In this video you'll learn: 1.⁠ ⁠Cold open on the chart. What the dots are actually plotting, and why a dot under price is a stop and not a buy signal 2.⁠ ⁠The mechanic of a flip. Price touches the dot, the dot jumps to the other side, the trend label changes. Where the flip is real and where it is noise 3.⁠ ⁠Reading the gap. How to convert the distance between price and dot into a percentage, and what a tight gap versus a wide gap says about how fragile the trend is 4.⁠ ⁠Finding fresh flips in the Option Samurai scanner. Using the Parabolic SAR filter with the Flipped to Bullish preset instead of scrolling charts one at a time 5.⁠ ⁠Tightening the room in Advanced View. Setting the SAR percent range from 0 to 2 and constraining how many bars ago the flip occurred, so you get recent strength and not stale strength 6.⁠ ⁠From signal to a real trade. A short put on Salesforce struck at 220, sitting just below the 220.29 dot, with the bid, the spread, the probability of expiring worthless and the annualized return all on screen 7.⁠ ⁠Stress testing it. The free SAR backtest on the same ticker, showing what happened over the 10 trading days after each Flipped to Bullish reading against the average day, across 80 flips The point is not that Parabolic SAR works. The point is that you can measure whether it works on the specific stock you are about to trade, before you put money on it. Most traders never run that check, then wonder why a textbook setup behaved differently than the textbook. ⸻ About Option Samurai Option Samurai helps you find better trades, faster. Our scanner and tools are built for serious options traders who want clarity, speed and an edge. ⸻ 🚀 GET STARTED 🌐 Start the 14 day free trial and build the scan yourself: https://optionsamurai.com/ 📖 Run the backtest on your own ticker here: https://optionsamurai.com/blog/backtesting-sar-filter/ ⸻ 👍 Like the video if you want the scanner filters, the strike logic and the backtest numbers to keep coming 🔔 Subscribe for more scanner filters, strike logic and backtest numbers 💬 If you have a stock you want tested against the SAR flip, drop the ticker in the comments and we will run it. Chapters: 0:00 What the dots are actually plotting 0:27 Reading the gap 0:48 Finding fresh flips in the scanner 1:07 Tightening the room in Advanced View 1:20 From signal to a real trade 1:52 Stress testing it: 80 flips since 2019

Why Your Credit Spreads Need a Ladder Not a Launch Day thumbnail

Why Your Credit Spreads Need a Ladder Not a Launch Day

Credit spreads fail for a reason almost nobody explains on camera: the day you open them. Open five on the same Monday and every position shares one entry price, one volatility read and one expiration, so one bad week decides all of them at once. This video shows the fix, and the scans that find the candidates: cap the downside on every trade, ladder your entry days so timing stops being a single throw, and manage on a schedule instead of a feeling. We build it end to end. First a bull put spread from scratch, with the real numbers: selling the 95 put, buying the 90 put, the credit you keep and the exact worst case you accept before the trade is even live. Then the schedule. From one trade to a ladder, including how many spreads stay open at the same time depending on whether you trade 3 month, 6 month or 1 year expirations. Next, the three rules a trade has to pass before it gets in: where to sell the short strike, how to size a position on max loss instead of on the credit you collect, and why RSI is a timing tool, not a reason to trade. You will also see the exact scanner filters used to build the candidate list, from days to expiration and probability of max profit through IV rank, liquidity and bid ask spread. Then diversification, where you pick a school first and spread the risk three ways, and the weekly management check: what to do when a trade is up 50 percent with time left, and what to do when your short strike gets crossed. The last section covers margin, the leverage most traders never account for, and the one sizing mistake that turns a good ladder into a margin call. If you sell options, this is the part of credit spreads that actually decides your year. ⸻ About Option Samurai Option Samurai helps you find better trades, faster. Our scanner and tools are built for serious options traders who want clarity, speed and an edge. ⸻ 🚀 GET STARTED 🌐 Start free with Option Samurai. Run the same scans shown in this video on live market data: https://optionsamurai.com 📖 Read the full breakdown: [Blog post link] ⸻ 👍 Like this video if the ladder idea changed how you think about entry timing 🔔 Subscribe for systematic options strategy, not market predictions 💬 Comment with your cadence, every week or every other week, and I will tell you what it costs you in concentration Chapters 0:00 Why opening all your spreads on one day is risky 1:26 The bull put spread, with real numbers 2:45 From one trade to a ladder 3:29 How many spreads are open at once 4:20 The rules: short strike and position size 5:11 Why RSI is a timing tool, not a reason 5:58 The scanner filters 7:25 Diversification: two schools 8:24 Diversification: time, direction, sector 9:10 The weekly management check 10:16 Margin and leverage

The Options Dojo | Option Samurai