Reverse Iron Butterfly - Setup, Payoff, and When to Use It
Published on May 29, 2025 | 8 min read(Last updated on April 3, 2026)
Table of Contents
- Key Takeaways
- What Is a Reverse Iron Butterfly?
- Reverse Iron Butterfly vs Other Volatility Strategies
- When to Use a Reverse Butterfly Spread
- Reverse Iron Butterfly Payoff and Break-Even Points
- Reverse Iron Butterfly Example with Numbers
- Risks and Rewards of the Reverse Iron Butterfly
- Impact of Time Decay and Volatility
Reviewed by Leav Graves
Table of Contents
- Key Takeaways
- What Is a Reverse Iron Butterfly?
- Reverse Iron Butterfly vs Other Volatility Strategies
- When to Use a Reverse Butterfly Spread
- Reverse Iron Butterfly Payoff and Break-Even Points
- Reverse Iron Butterfly Example with Numbers
- Risks and Rewards of the Reverse Iron Butterfly
- Impact of Time Decay and Volatility
Traders use the reverse iron butterfly when they expect a big move-but don’t know which way. This strategy blends calls and puts to cap risk while betting on volatility. In this article, we’ll break down how a reverse butterfly spread works, how to set it up, and when to use it.
KEY TAKEAWAYS
- A reverse iron butterfly is a debit spread designed to profit from big price swings - even if you don’t know which way the stock will move.
- You lose the most only if the stock ends up right at the middle strike. If it moves in either direction, you can often come out ahead.
- It’s a strategy that works best when you expect action, especially in high-volatility markets.
What Is a Reverse Iron Butterfly?
A reverse iron butterfly is a debit spread built to profit from large price moves, even if you’re not sure whether the stock will go up or down. The setup combines two strategies: a long straddle at the center and two short wings placed further out-of-the-money.
To build a reverse butterfly spread, you open four positions-all using options with the same expiration:
- Buy an at-the-money call
- Buy an at-the-money put
- Sell an out-of-the-money call (above the stock price)
- Sell an out-of-the-money put (below the stock price)
This creates a structure where your losses are capped (you paid a debit to enter), and your profits are also capped but kick in when the stock moves significantly in either direction. The typical P&L chart of a reverse iron butterfly has this shape:
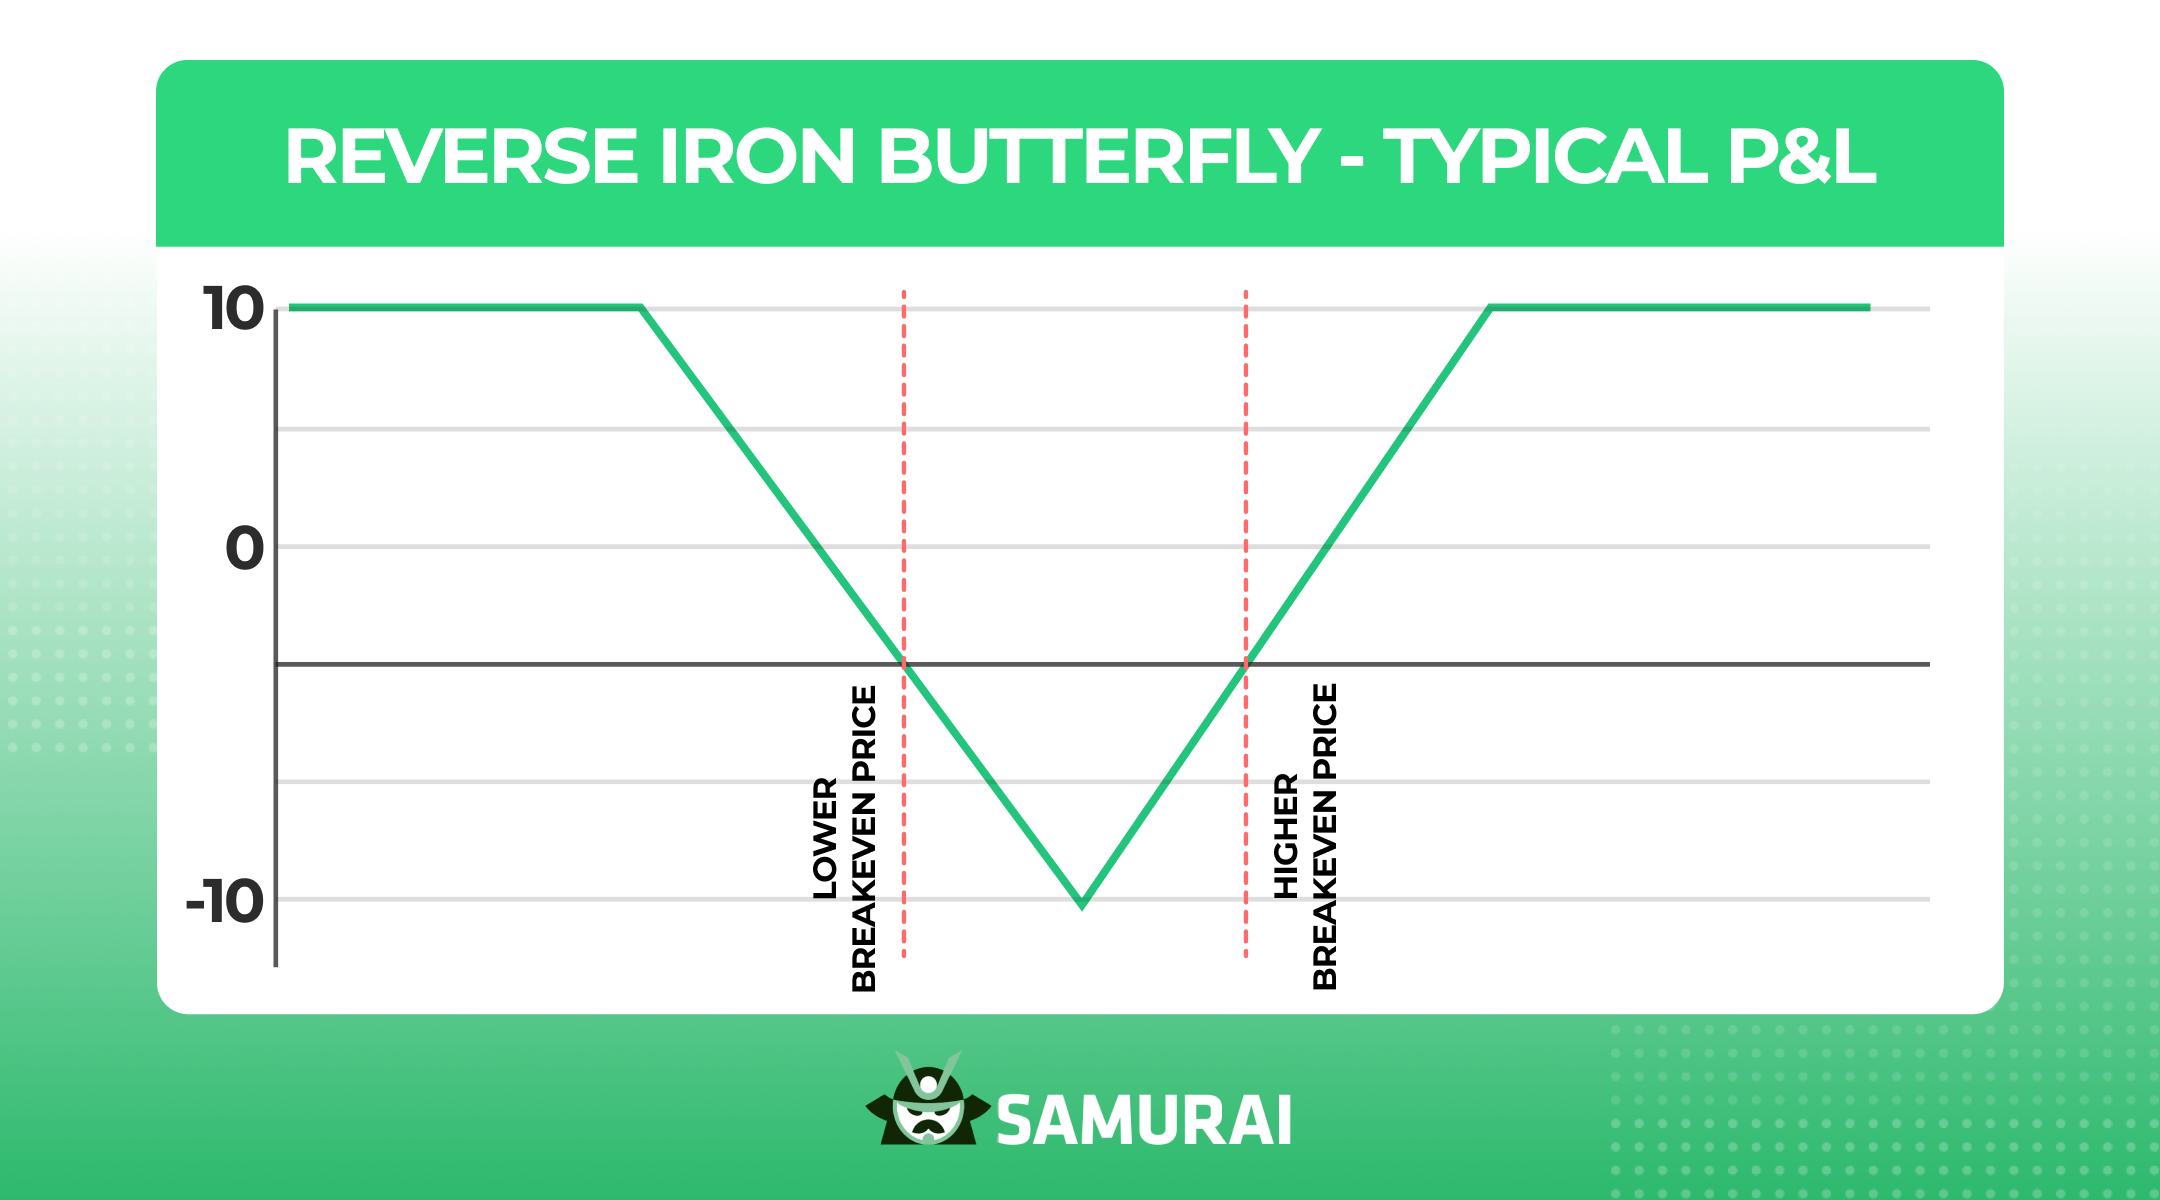
The term reverse butterfly or reverse butterfly spread comes from flipping the payoff structure of a regular iron butterfly. Instead of benefiting when the stock stays still, you want it to move-fast and far.
How far you place the short strikes will shape your trade:
- Wider wings = bigger profit potential, higher cost
- Closer wings = cheaper entry, smaller payoff range
Each leg must use the same number of contracts. And yes, you can enter all four legs at once or leg into the position, but the goal is always the same: capture a strong move without picking a direction.
Reverse Iron Butterfly vs Other Volatility Strategies
The reverse iron butterfly has the same goal as a long straddle (which is a trade setup you can find on our options screener): to profit from a big move in either direction. However, this strategy is often cheaper to open. That’s because the reverse butterfly adds short legs to offset the cost of buying both an at-the-money call and put. The trade-off? Profit is capped.
Here’s how it compares to other volatility strategies:
- Versus a long straddle: Lower cost, but also lower potential reward.
- Versus a reverse iron condor: Both aim to profit from a big move. The reverse butterfly typically concentrates risk into a narrower center zone, while a reverse iron condor spreads that middle risk a bit wider and is often cheaper to enter. If you’re looking for the neutral, credit-based (non-reverse) version designed for quiet markets, see the iron condor strategy.
- Versus a long strangle: More balanced. The reverse iron butterfly places both longs at-the-money, giving a tighter setup if a quick move happens.
And by the way, you can also compare it to the more flexible and time-decay-focused double diagonal spread, which takes a very different approach to volatility management.
Traders who can’t use margin for credit spreads often prefer the reverse butterfly. It’s directional-neutral, relatively low-cost, and comes with known max loss and max gain from the start.
When to Use a Reverse Butterfly Spread
Use a reverse iron butterfly when you expect a big price move but have no clue which direction it’ll go. This makes it a good fit for volatile markets-just make sure the move happens quickly enough to beat time decay.
But watch out: many traders get burned using it before earnings or big news events. Why? Implied volatility (IV) often drops right after the announcement, which works against you (it’s the so-called “IV crush” phenomenon). The reverse butterfly needs IV to go up-not down.
Best use cases:
- Market feels tense, but no clear trend
- You expect a breakout but not sure which way
- You want defined risk on both sides of the move
To reach profitability, the stock needs to move far enough beyond your short strikes to overcome the debit you paid. If it stays in the middle, you lose. This is why the reverse butterfly spread is not for quiet days or sideways markets. If you’re evaluating alternatives for quieter markets instead, our guide on condor spreads breaks down the neutral version built to profit from stability rather than movement.
Reverse Iron Butterfly Payoff and Break-Even Points
The reverse iron butterfly pays off when the stock makes a big move - either up or down - beyond the short strikes. The bigger the move, the closer you get to max profit. If the stock stays near the middle strike, you hit max loss.
Here’s how it works:
- Suppose stock ABC is trading at exactly $200
- Buy $200 call and $200 put
- Sell $210 call and $190 put
- Net debit: Let’s suppose this is equal to $6.00
- Max profit: width of wings ($10) – debit paid ($6) = $4 or $400 per spread
- Max loss: $6 or $600 per spread
You reach max profit if the stock closes above $210 or below $190 at expiration.
Break-even points
To calculate break-evens:
- Upper break-even = $200 (long call) + $6 = $206
- Lower break-even = $200 (long put) – $6 = $194
If the stock closes at $208, you make $200: the long call is worth $8, you paid $6, so profit is $2 per share.
The reverse butterfly spread is easy to track - defined risk, defined reward. But you need the stock to move enough to cross one of those break-even points, or you’re in the red.
Reverse Iron Butterfly Example with Numbers
Let’s say you run our custom scan feature (a way to find trades you would not be able to find anywhere else) and spot an interesting setup on Amazon (AMZN), which is trading at $200.99. You expect a sharp move (up or down) but you're not sure about the direction. Perfect candidate for a reverse iron butterfly.
Here’s how you set it up:
- Buy a $202.5 call
- Buy a $202.5 put
- Sell a $210 call
- Sell a $195 put
All contracts expire in about a week.
This creates a reverse iron butterfly with tight wings, making it cheaper to enter while still offering a decent reward if AMZN moves quickly. The P&L chart would look like this:
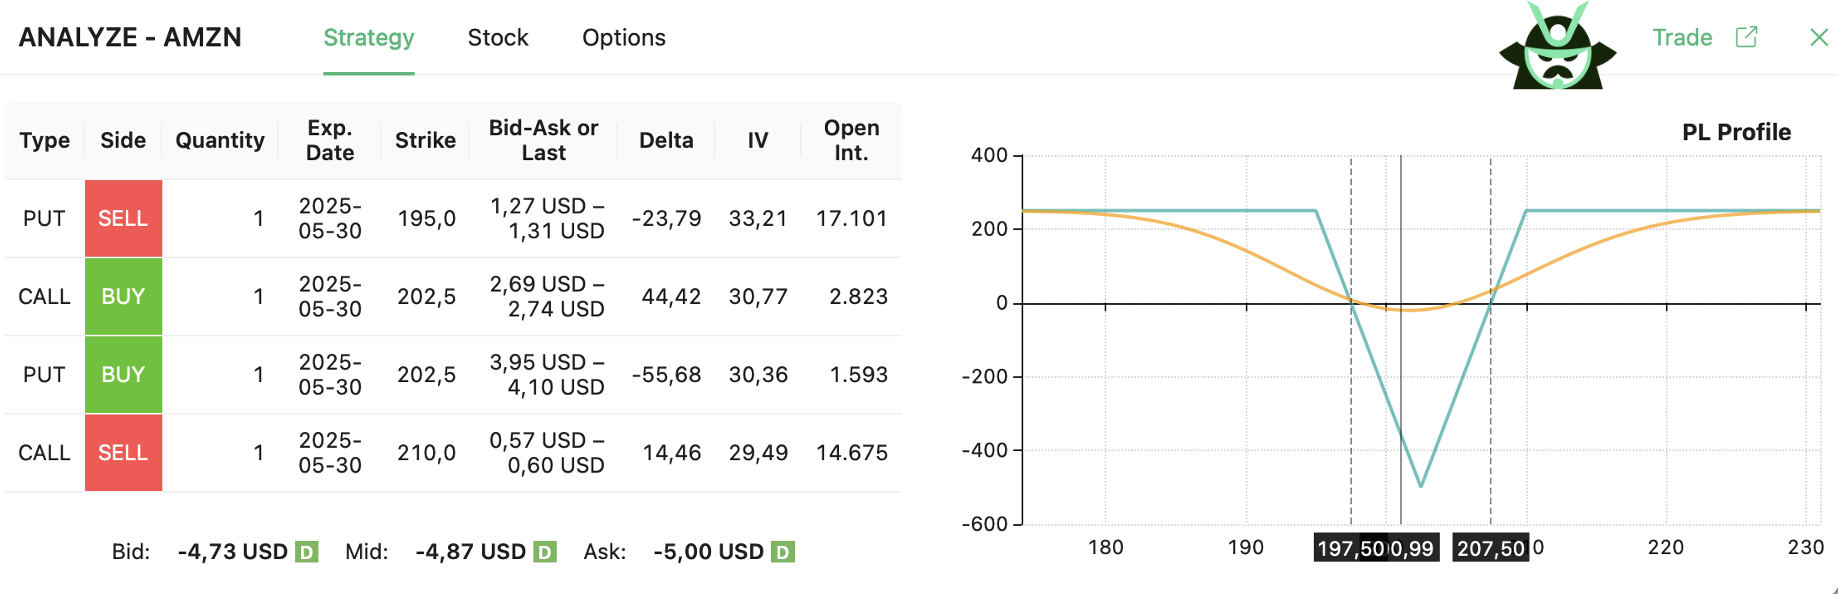
As shown in the chart, your max profit is over $200, and it occurs if AMZN finishes below $195 or above $210 by expiration. Your break-even range is between $197.50 and $207.50. You need a solid move outside this range to reach profitability.
Now here’s the catch: if AMZN closes right at the middle strike (i.e., $202.5) you hit max loss, which is a little less than $500. That’s the trade-off for not having to pick a direction.
Would we take this trade? It depends on our outlook. If we were expecting a quick and volatile move, it could make sense. If not, time decay and lack of movement can eat into your position. Either way, the setup clearly shows how a reverse butterfly works: relatively low cost, capped risk, and high reward if the stock breaks out of its range.
Risks and Rewards of the Reverse Iron Butterfly
The reverse iron butterfly has well-defined risk and reward, which makes it easy to plan around. Your maximum loss is the debit you pay to open the trade. This happens if the stock finishes exactly at the middle strike. On the flip side, your max profit is the width of the wings minus the debit paid.
The catch? You need the stock to move far enough to cross one of the break-even points before expiration. If it doesn’t move, or if volatility drops, the trade starts losing value fast.
What to keep in mind:
- Max risk = debit paid
- Max reward = width of spread – debit
- Time decay works against you every day the trade sits idle
- Low implied volatility makes this setup less attractive
- Best case: a sharp move up or down shortly after entry
The benefit of the reverse butterfly is that you don’t need to pick a direction - you just need action. But if you’re wrong on timing or volatility, it can quickly go south. That’s why many traders use the reverse butterfly spread around events that could spark big moves - but not after the news is out.
Impact of Time Decay and Volatility
Your reverse iron butterfly will not sit still in your portfolio. Every day that passes without a strong move eats into its value. That’s time decay, or theta, working against you. Since the strategy includes two long options, the clock is not your friend - unless the move comes quickly.
What helps is implied volatility. When IV goes up, the premiums of your long options increase, which boosts your position. This makes the reverse butterfly a vega-positive strategy. The best-case setup is simple: get in when volatility is low, and get out after a big move when volatility spikes.
Here’s how time and volatility play into the trade:
- Time decay hurts: You’re paying for time, and it loses value every day
- Volatility helps: Higher IV means more value in your long call and put
- Fast move = better outcome: You want the stock to break out early in the trade
- Don’t wait too long: Holding through expiration without a move usually means a loss
The reverse butterfly spread is built to catch movement - not to sit around. If the market stays quiet or volatility drops, your window to exit with a profit gets smaller by the day.
AUTHOR
 Gianluca LonginottiFinance Writer - Traders Education
Gianluca Longinotti is an experienced trader, advisor, and financial analyst with over a decade of professional experience in the banking sector, trading, and investment services.
REVIEWER
 Leav GravesCEO
Leav Graves is the founder and CEO of Option Samurai and a licensed investment professional with over 19 years of trading experience, including working professionally through the 2008 financial crisis.